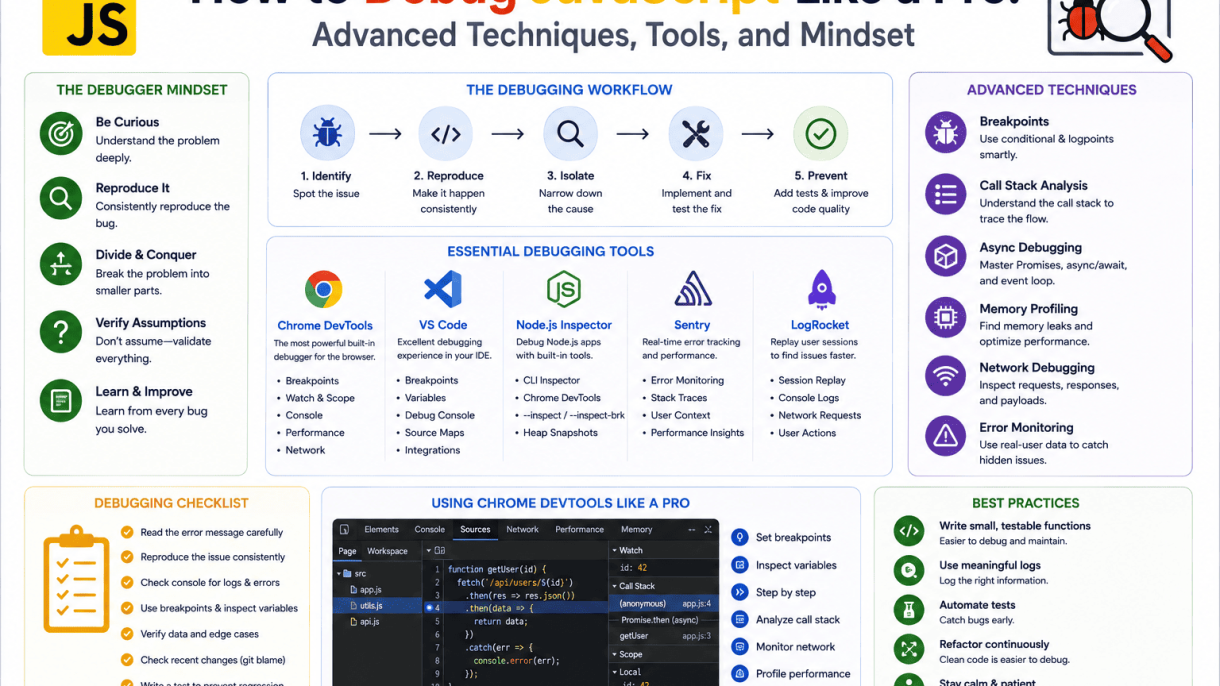

1. Shift Your Mindset: Debugging as a Systematic Process
Professional debugging is not a frantic scramble through console logs or a lucky guess followed by a refresh. It is a structured investigation—a disciplined interrogation of your own code. The difference between a junior and a senior developer often comes down not to typing speed, but to how they approach failure. When you treat debugging as a random hunt, you are at the mercy of chance. When you treat it as a scientific process, you become the detective, and the bug becomes a solvable case.
Why guessing leads to wasted time and hidden bugs
Guessing feels productive because it produces immediate action. You see an error, you change a variable, you refresh the page. But this “shotgun debugging” has two critical flaws. First, it wastes time: you might change five unrelated things before stumbling on the real culprit, and each change risks introducing a new issue. Second, and more dangerously, guessing masks root causes. A quick fix might make the symptom disappear today, but the underlying logic flaw remains dormant, waiting to resurface under different data or a different browser. Hidden bugs are the most expensive bugs because they are discovered by users, not by you. Every guess you make without evidence is a bet against your own future debugging session.
The scientific method applied to JavaScript errors
The scientific method maps perfectly onto JavaScript debugging. It replaces chaos with clarity. Follow this four-step loop for every issue, no matter how trivial it seems:
- Observe: Reproduce the bug consistently. Capture the exact error message, the stack trace, the browser, the input data, and the user action that triggered it. Write it down. Vague observations lead to vague hypotheses.
- Hypothesize: Form a single, testable explanation. Instead of “the function is broken,” say “the function fails because
user.idisundefinedwhen the API returns a 204 No Content response.” One hypothesis, not three. - Test: Design the smallest experiment to confirm or deny your hypothesis. Use a targeted
console.logat the exact line, a breakpoint, or a unit test. Do not test multiple variables at once—change one thing and observe the result. - Iterate: If the test confirms your hypothesis, you have found the cause. If it denies it, discard that hypothesis and form a new one based on the new evidence. Repeat until the bug is fixed, then verify the fix did not break adjacent functionality.
Cultivating a debugging-first mindset for long-term efficiency
Adopting a debugging-first mindset means accepting that your code will fail, and that failure is information, not a personal insult. This mindset has three pillars. First, patience: resist the urge to fix immediately. Spend the first five minutes understanding the problem, not solving it. Second, curiosity: ask “why” repeatedly. Why does this variable hold that value? Why is this loop skipping an iteration? Why did the promise reject here and not earlier? Third, humility: assume your assumption is wrong. The bug is rarely where you think it is; it is often in the interaction between two modules, in an edge case you did not consider, or in a third-party library’s behavior. To make this concrete, adopt these daily habits:
| Habit | Why it works |
|---|---|
| Write a failing test before fixing | Forces you to define the expected behavior precisely. |
| Read the full stack trace | The top line is the symptom; the bottom frames are the cause. |
| Explain the bug to an imaginary colleague | Verbalizing your logic exposes gaps in your reasoning. |
| Take a break after 20 minutes of staring | Your subconscious continues the analysis while you reset. |
When you shift from “fix this now” to “understand this fully,” you stop fighting fires and start building a mental model of your codebase. That model is what turns a chaotic debugging session into a predictable, almost boring, process. And in professional software, boring is beautiful—because it means the bug is dead, and you know exactly why.
2. Master the Browser’s DevTools: Beyond console.log
While console.log is a fine starting point, it quickly becomes noise in complex applications. The true power of debugging lies in the Sources panel of Chrome DevTools (or equivalent tools in Firefox and Edge). This panel transforms your browser into a full-fledged debugger, allowing you to pause execution, inspect state, and trace logic step-by-step. The core workflow is simple: set a breakpoint, trigger the code path, and observe. But to debug like a pro, you need to move beyond simple line pauses and use the panel’s more surgical features.
Setting conditional breakpoints and logpoints for targeted pauses
Breakpoints that pause on every iteration of a loop or every call to a high-frequency function are counterproductive. Instead, use conditional breakpoints. Right-click on a line number in the Sources panel, select “Add conditional breakpoint,” and enter an expression. The debugger will only pause when that expression evaluates to true.
// Example: Pause only when the user object has an invalid email
// In the conditional breakpoint dialog: user.email && !user.email.includes('@')
For situations where you only need to log a value without pausing, use a logpoint. Right-click the line, choose “Add logpoint,” and type an expression wrapped in curly braces (e.g., {user.id}). The value will appear in the Console without breaking execution. This is invaluable for monitoring production-like flows where pausing would alter timing.
Navigating the call stack and scope to trace execution flow
When a breakpoint hits, the Call Stack pane on the right side of the Sources panel shows the chain of function calls that led to this point. Click any frame to jump to that line of code. More importantly, the Scope pane directly below it lists all variables available in the current context — local, closure, and global. This is where you answer the “why” behind a bug.
To trace execution effectively:
- Use the Step Over (F10) to execute the current line without entering functions.
- Use Step Into (F11) to dive into the called function.
- Use Step Out (Shift+F11) to return to the caller once you’ve seen enough.
- Hover over any variable in the code to see its current value, or add it to Watch for persistent visibility.
Pay special attention to closure variables in the Scope pane — they often hold stale values that cause subtle bugs. The Scope pane updates live as you step, so you can watch a variable mutate across iterations.
Using console methods (table, trace, time) for structured logging
When you do need to log, move beyond console.log. The console API offers structured methods that reduce visual clutter and provide deeper insights:
| Method | Use Case |
|---|---|
console.table(array) |
Displays an array of objects as a sortable table, ideal for comparing multiple properties at once. |
console.trace() |
Prints the full call stack at that point, without pausing — useful for seeing which code path called a function. |
console.time(label) / console.timeEnd(label) |
Measures the duration between the two calls, perfect for profiling small code segments. |
console.group() |
Nests logs under a collapsible heading, keeping related output together. |
For example, when debugging a list of fetched items, console.table(items) instantly reveals missing fields or inconsistent types. Similarly, wrapping a suspected slow function with console.time('parse') and console.timeEnd('parse') gives you a precise millisecond readout. These methods, combined with breakpoints, turn the console from a dumping ground into a structured diagnostic tool.
Finally, remember to use the Sources panel’s “Pretty-print” button (the curly braces { }) on minified files. This converts compressed code into readable, indented JavaScript, making breakpoints and scope inspection feasible even in production bundles. Master these techniques, and you’ll stop guessing and start knowing exactly what your code does at every step.
3. Leverage the Power of Breakpoints and Stepping
Mastering breakpoints transforms debugging from guesswork into systematic investigation. While a simple line breakpoint pauses execution at a specific line, professional debugging requires conditional, event, and exception breakpoints that target the exact moment a problem manifests. Combined with disciplined stepping, these tools let you trace the precise path of your data through complex logic.
Configuring event and exception breakpoints to catch runtime errors
Exception breakpoints are your first line of defense against uncaught errors. In Chrome DevTools, the Sources panel offers a “Pause on exceptions” toggle with two modes: Pause on caught exceptions and Pause on uncaught exceptions. For production debugging, always enable both temporarily—caught exceptions often hide bugs that are silently swallowed by try/catch blocks. Event breakpoints, meanwhile, let you pause when specific browser events fire (e.g., click, keydown, fetch). This is invaluable for debugging user interaction issues where the problem occurs before your code even runs. In the Event Listener Breakpoints panel, expand categories like “Control” or “Pointer” and check the events you suspect are misbehaving.
Stepping through asynchronous and callback-heavy code
Asynchronous code breaks the linear execution model, making traditional stepping confusing. When you pause inside a setTimeout callback or a Promise resolution, use the Async checkbox in the Call Stack panel. This reveals the asynchronous chain that led to the current execution context, showing you the “parent” frame that scheduled the callback. For stepping, remember these commands:
- Step over (F10): Executes the current line without entering functions. Use this to skip trivial calls like
console.log. - Step into (F11): Enters the called function. Critical for callbacks—when you step into a Promise’s
.then(), you land inside the executor function. - Step out (Shift+F11): Runs until the current function returns. Perfect for escaping deep callback nesting when you’ve found the issue.
For async-heavy code, set a breakpoint inside the callback itself rather than stepping into it. This avoids the confusing jump between microtask and macrotask queues.
Editing variables in the debugger to test hypotheses without restarting
Modern debuggers allow live mutation of state, eliminating the restart-reproduce cycle. While paused, hover over any variable in the Scope panel and double-click its value to change it. For example, if a function fails because user.age is undefined, set it to 30 directly and resume execution. This tests whether the rest of the logic works correctly with valid data, isolating the bug to the data source. You can also execute arbitrary expressions in the Console while paused—these run in the current execution context, giving you access to local variables. To automate this, right-click a breakpoint and select “Edit breakpoint” to add a condition (e.g., items.length > 5) or a logpoint that prints values without pausing.
| Technique | Use Case | Key Shortcut (Chrome) |
|---|---|---|
| Conditional breakpoint | Pause only when a variable meets a threshold | Right-click line → “Add conditional breakpoint” |
| Exception breakpoint | Catch silent failures in try/catch blocks | Sources → “Pause on exceptions” checkbox |
| Step into | Trace execution into a Promise or callback | F11 |
| Variable edit | Change state mid-execution to test logic paths | Double-click value in Scope panel |
Combine these techniques strategically: set an exception breakpoint to catch the error, step into the failing function to inspect its scope, then edit the offending variable to confirm your fix before writing any code. This iterative loop—pause, inspect, mutate, resume—turns debugging into a fast, evidence-driven process.
4. Tame Asynchronous JavaScript: Debugging Promises and Async/Await
Asynchronous code is where JavaScript debugging goes from tricky to treacherous. The call stack you see at the moment of an error often bears no resemblance to the sequence of events that caused it. To debug async code like a pro, you must shift your mental model from a linear stack to a time-based queue. The key is not just seeing where something failed, but when it was scheduled relative to other tasks.
Understanding the event loop and microtask queue for async debugging
Before you can debug a promise, you must understand its execution order. JavaScript runs a single thread, but it manages concurrency through two queues: the macrotask queue (containing setTimeout, setInterval, I/O events) and the microtask queue (containing promise callbacks, queueMicrotask, and async/await continuations). The critical rule: after each macrotask, the engine drains the entire microtask queue before rendering or processing the next macrotask. This means a promise chain can starve timers.
When debugging, always ask: “Is this code running in a microtask or a macrotask?” If you see a setTimeout firing before a promise resolution, check if the promise is nested inside another promise that never resolves. Use the Event Listener Breakpoints panel (in Chrome DevTools) to pause on setTimeout or Promise calls. Then, in the Call Stack pane, toggle the “Async” checkbox to reveal the full asynchronous chain—this shows the original scheduling context, not just the current frame.
Using async breakpoints and ‘pause on uncaught exceptions’
Standard line breakpoints stop at the current execution, but async code often fails silently. Enable “Pause on uncaught exceptions” in the Sources panel (the pause icon with a stop sign). This catches rejected promises that are not handled, but be warned: it also fires on errors you catch later. To filter, use the “Pause on caught exceptions” dropdown and select “Uncaught” only.
For deeper control, use async breakpoints via the debugger statement inside a .catch() block:
fetch('/api/data')
  .then(response => response.json())
  .catch(error => {
    debugger; // Pauses here, but the async stack trace above shows the fetch call site
    console.error('Fetch failed:', error);
  });
When the debugger pauses, expand the Scope panel to inspect the promise’s [[PromiseState]] and [[PromiseResult]]. In Chrome, right-click the promise variable in the console and select “Store as global variable” to inspect its internal slots.
Debugging race conditions and timing issues with performance tools
Race conditions occur when two async operations complete in an unexpected order. The most common culprit is a shared variable mutated by multiple promises. To identify these, use the Performance panel (not just the console). Record a session, then look at the Timings track. Each async task appears as a colored block; hover to see its duration and origin. For microtask-heavy code, enable the “Async” checkbox in the Flame Chart to visualize promise chains as nested bars.
For timing-specific bugs, add performance marks in your code:
performance.mark('fetch-start');
fetch('/api/data')
  .then(() => performance.mark('fetch-end'))
  .then(() => performance.measure('fetch-duration', 'fetch-start', 'fetch-end'));
// In console: performance.getEntriesByName('fetch-duration')
Then use performance.getEntriesByName() to see if the duration exceeds your threshold. If you suspect a timer race, check the Event Loop section in the Performance panel’s bottom summary—it shows the number of tasks per millisecond. A spike in microtasks between two timers indicates a starvation issue.
Finally, use conditional breakpoints with a counter to pause only when a race condition likely occurs:
let counter = 0;
async function raceProne() {
  counter++;
  if (counter === 3) debugger; // Pause on the third invocation
  await someAsyncTask();
}
This targeted approach prevents you from stepping through hundreds of benign calls. Remember: async debugging is about capturing the sequence, not the state. Always inspect the async stack trace before mutating any variable.
5. Network and Source Mapping: Debugging Compiled or Bundled Code
Modern JavaScript rarely runs in the browser as authored. TypeScript, Babel, and bundlers like Webpack or Vite transform, transpile, and minify your code into optimized production assets. Debugging this output directly is a nightmare of single-letter variables and collapsed logic. The solution lies in source maps—files that act as a bridge between the executed code and your original source. When configured correctly, the browser’s DevTools reconstructs your pre-build files, allowing you to set breakpoints, inspect variables, and step through code exactly as you wrote it, even in production.
Enabling and verifying source maps in your build toolchain
Source maps are not automatic; you must explicitly enable them in your build configuration. The exact setting varies by tool, but the principle is consistent: generate a .map file for each output bundle and reference it via a comment (e.g., //# sourceMappingURL=app.js.map).
- Webpack: In
webpack.config.js, setdevtool: 'source-map'for production (or'inline-source-map'for development). This emits separate.mapfiles. - Vite: By default, Vite generates source maps for development. For production builds, set
build.sourcemap: trueinvite.config.js. - TypeScript: In
tsconfig.json, add"sourceMap": trueto the compiler options. - Babel: When using Babel CLI or a plugin, pass
sourceMaps: true(or"inline") in your configuration.
To verify that source maps are working, open DevTools and go to the Sources panel. Look for your original files (e.g., src/App.tsx) in the file tree. If you only see minified bundles, source maps are not loaded. Additionally, in the Network panel, filter by .map files; you should see requests for them alongside your JavaScript bundles. A quick way to test: add a debugger statement in your TypeScript source, reload, and check if the debugger pauses on the original line, not the compiled one.
Debugging minified code using pretty-print and source map navigation
If source maps are missing or you are working with a third-party script, the Pretty-Print feature is your first tool. In the Sources panel, click the curly braces { } icon at the bottom of the editor pane. This reformats minified code into readable, multi-line JavaScript, adding indentation and line breaks. While this does not restore original variable names, it makes control flow and function boundaries visible.
For full fidelity, rely on source maps for navigation. Once loaded, the Sources panel shows a tree with your original folder structure. You can:
- Set breakpoints directly in the original TypeScript or JSX files.
- Step through code and see the exact variables as they were named in your source.
- Use the Call Stack to trace back through both bundled and original frames.
When debugging minified code without maps, use the Search (Ctrl+Shift+F or Cmd+Shift+F) to find a unique string or function name that may survive minification (e.g., an API endpoint URL). Then, set a breakpoint on that line and inspect the surrounding scope. Remember that minifiers may rename functions to short identifiers, so searching for a property name like fetchUser may fail if it was shortened—search instead for a literal string in your code.
Using the Network panel to inspect API calls, headers, and payloads
API-related bugs often stem from incorrect request payloads, missing authentication headers, or unexpected response structures. The Network panel is your diagnostic tool. Open it, reload your page, and filter by Fetch/XHR to see only AJAX requests.
| Task | How to do it |
|---|---|
| Inspect request payload | Click on a request, then open the Payload tab to view the exact JSON or form data sent to the server. |
| Check response data | Open the Response or Preview tab to see the raw or parsed response body. |
| View headers | Go to the Headers tab. Expand Request Headers and Response Headers to verify content-type, authorization tokens, and CORS settings. |
| Simulate a failed request | Right-click the request and select Block request URL to test error handling logic. |
For deeper debugging, use the Console alongside the Network panel. Right-click on a network request and select Copy as fetch. This generates a snippet you can modify and re-run in the console to test different payloads or headers without refreshing the page. Also, enable the Preserve log checkbox to keep requests visible across page navigations, which is critical for debugging redirects or single-page app routing issues.
Combine network inspection with source-mapped breakpoints: set a breakpoint in your API service layer, then check the Network panel to see if the request was even sent. If it was not, the bug is in your code before the fetch call. If it was sent but the response is unexpected, inspect the response body and compare it against your TypeScript interface or validation logic.
6. Reproduce and Isolate Bugs with Minimal Test Cases
When a bug surfaces in a complex application, the fastest path to a fix is not staring at the entire codebase—it is shrinking the problem until only the essential failing part remains. A minimal test case is a self-contained snippet that reproduces the bug with the least amount of code, data, and UI. This discipline forces you to separate symptoms from causes, and it makes collaboration with colleagues or community members far more effective. The process is simple: start with the full application, then strip away everything that does not contribute to the error.
Crafting a minimal reproduction case that highlights the bug
Begin by copying the relevant logic into a standalone environment such as CodePen, JSFiddle, or a local HTML file with a single <script> tag. The goal is to remove dependencies on your build system, external libraries (except the one suspected), and server calls. Replace real data with hardcoded values that trigger the issue. For example, if a sorting function fails on a specific array shape, hardcode that array. If a React component throws, render it with static props. A good reproduction includes:
- One file (or two if HTML/CSS separation is necessary) with no external imports.
- Hardcoded input that reliably fails.
- Console output or a visible error that demonstrates the bug.
- Comments indicating the expected vs. actual behavior.
Once you have this, you can bisect the logic itself. Comment out half of the function, then test. If the bug disappears, the culprit is in the commented half; if it persists, it is in the active half. Repeat this halving until you isolate the exact line. This is the same binary search principle used in algorithms, and it turns a vague “something breaks” into a precise “this condition returns the wrong value.”
Using git bisect to find the commit that introduced a regression
When the bug is a regression—something that used to work but now fails—git bisect is your best tool. It performs a binary search over your commit history to locate the exact change that broke the behavior. Start by marking a known good commit and a known bad commit (usually HEAD). Then run:
git bisect start
git bisect bad                 # current commit is broken
git bisect good <commit-hash>  # last known working commit
Git will check out a middle commit. Test it manually or with a script (e.g., npm test or a custom reproduction command). Then mark it:
git bisect good # or: git bisect bad
Repeat until git reports the first bad commit. This process typically takes only log₂(n) steps, so even a repository with 2,000 commits requires about 11 checks. To automate, you can pass a command that exits with 0 for good and 1 for bad: git bisect run npm test. Once finished, run git bisect reset to return to your original branch. The identified commit will show you the exact code change, and you can then craft a minimal reproduction from that diff.
Simplifying complex state and UI to isolate the failing logic
User interfaces hide bugs behind layers of state, event handlers, and rendering. To isolate the failing logic, strip the UI down to its bare bones. If a button click causes an error, replace the button with a setTimeout that calls the same handler. If a form submission fails, hardcode the form data and call the validation function directly. For React or Vue, render the component without its parent, or use a state mock like a plain object instead of a global store. The key is to separate the logic from the presentation. For example, if a state update produces the wrong value, extract the reducer or state transition into a pure function and test it in isolation:
// Before: complex component with many props
function reducer(state, action) {
  switch (action.type) {
    case 'INCREMENT': return { ...state, count: state.count + action.amount };
    default: return state;
  }
}
// Minimal test: call reducer directly with hardcoded state
console.log(reducer({ count: 1 }, { type: 'INCREMENT', amount: 5 })); // { count: 6 }
If the pure function works, the bug lies in how the UI dispatches actions or passes props. If it fails, you have isolated the logic. This approach also helps when the bug only appears after a specific sequence of user interactions—recreate that sequence as a series of function calls, not clicks. By reducing the UI to a script, you eliminate timing issues, rendering delays, and CSS interference, leaving only the core computation visible.
7. Employ Logging Strategies That Actually Help
Console.log is the duct tape of debugging—it works, but it creates a messy, unreadable trail. To debug JavaScript like a pro, you need structured, semantic logging that provides clarity at a glance. Replace random print statements with deliberate, categorized output that tells a story about your application’s state, flow, and failure points. This section covers concrete techniques to transform your console from a chaotic dump into a diagnostic instrument.
Using console.group, console.time, and custom formatters for clarity
Raw console output loses context. Use console.group and console.groupCollapsed to nest related logs under a collapsible header. This lets you trace an entire request lifecycle or a function call stack without scrolling through hundreds of lines.
console.groupCollapsed('API Call: /users');
console.log('Request payload:', payload);
console.log('Response status:', res.status);
console.groupEnd();
For performance bottlenecks, console.time and console.timeEnd measure execution duration with zero setup. Pair them with console.assert to log only when a condition fails, reducing noise.
Custom formatters take clarity further. Override console.log to prepend timestamps or color-code by severity:
const originalLog = console.log;
console.log = (...args) => {
  originalLog(`[${new Date().toISOString()}]`, ...args);
};
This small change makes every log chronologically traceable—essential when debugging asynchronous flows.
Implementing a lightweight logger with severity levels and context
Stop using console.log for errors and warnings. Build a tiny logger that enforces severity levels—debug, info, warn, error—and attaches context like module name or user ID.
const logger = {
  level: 'info',
  log(level, message, context = {}) {
    const levels = ['debug', 'info', 'warn', 'error'];
    if (levels.indexOf(level) < levels.indexOf(this.level)) return;
    const prefix = `[${level.toUpperCase()}] [${context.module || 'app'}]`;
    console[level === 'debug' ? 'log' : level](prefix, message, context);
  },
};
Use it consistently across your codebase:
logger.log('debug', 'Cache miss', { key })— silent by default in production.logger.log('warn', 'Retrying fetch', { attempt })— visible but non-fatal.logger.log('error', 'Failed to parse JSON', { raw })— always shown.
This structured approach allows you to filter logs by level or module, making debugging sessions far more efficient than grepping for random strings.
Best practices for logging in production without leaking sensitive data
Production logging requires a different mindset. Your console is no longer a debugging playground—it’s a forensic tool. Follow these rules:
| Do | Don’t |
|---|---|
| Redact tokens, passwords, and PII before logging. | Log full request bodies or authorization headers. |
Use a logging library (e.g., pino, winston) with JSON output. |
Rely on console.log in production bundles. |
| Implement remote logging (e.g., Sentry, LogRocket) for errors. | Send debug-level logs to remote servers. |
Set a log level threshold (e.g., warn) for production. |
Log sensitive computed values like credit card numbers. |
To avoid performance hits, never log inside hot loops without a level guard. Use a library that supports async logging to offload I/O from the main thread. For remote logging, batch errors and send them in chunks to reduce network overhead.
Finally, audit your logs regularly. Remove or downgrade logs that no longer serve a diagnostic purpose. Every log line is a maintenance cost—keep only what helps you debug JavaScript like a pro when the next incident strikes.
8. Automate Debugging with Unit Tests and Assertions
Unit tests are not just a quality gate; they are a precision debugging instrument. When a bug surfaces, a well-written test converts a vague symptom into a concrete, reproducible failure. Instead of manually clicking through a UI or crafting console.log statements, you assert the exact expected behavior. This shifts your mindset from “why is this wrong?” to “what assumption is violated?”. Test frameworks like Jest and Mocha provide the scaffolding, while assertion libraries (e.g., Chai or Jest’s built-in expect) let you verify state, outputs, and thrown errors. The key is to treat tests as executable documentation of your code’s contract—when the contract breaks, the test tells you precisely which clause failed.
Writing failing tests that reproduce the bug before fixing it
This practice, often called test-driven debugging, forces you to isolate the bug before touching production code. Begin by writing a test that mimics the reported failure scenario as closely as possible. Use realistic inputs, edge cases, and the exact sequence of operations that triggered the issue. Run the test and watch it fail—this failure is your baseline. It confirms that your test actually captures the bug and that your fix will be verifiable. For example, if a function calculateDiscount returns NaN for a zero quantity, write a test that expects a numeric fallback. The failing assertion will reveal whether the problem lies in the input parsing, the arithmetic, or the return statement. Once the test fails for the right reason, you can debug with surgical precision, knowing that any subsequent green test means the bug is gone.
Debugging tests with the Node inspector or browser DevTools
Running tests in watch mode (jest --watch or mocha --watch) gives you instant feedback on every save, but sometimes you need to step through the logic itself. For Node-based tests, use the built-in inspector: run node --inspect-brk node_modules/.bin/jest --runInBand and open chrome://inspect in Chrome. This attaches the DevTools debugger to your test process, allowing you to set breakpoints inside test files and the source code they call. For browser-based tests (e.g., with Jest’s jsdom or Karma), use the browser’s DevTools directly. In Chrome, open the test runner page, navigate to the “Sources” panel, and set breakpoints in your test file. A common trick is to insert debugger; statements in the test or the code under test—when the test executes, execution pauses at that line, letting you inspect variables, call stacks, and scope. This is far more effective than logging because you can examine intermediate states without polluting the console.
Using code coverage to identify untested branches that may hide bugs
Coverage tools (Istanbul, integrated into Jest as --coverage, or nyc for Mocha) map which lines, functions, and branches your tests execute. A low branch coverage percentage is a red flag: it means that certain conditional paths—like an else clause, a catch block, or a ternary’s false branch—have never run. Bugs often hide in these untested branches because they are overlooked during manual testing. For instance, a function that handles both string and array inputs might have its array path completely untested, leading to a silent failure when an array is passed. By reviewing coverage reports, you can target your debugging efforts toward those dark regions. The table below summarizes the key differences between the two primary test runners for debugging workflows:
| Feature | Jest | Mocha |
|---|---|---|
| Built-in assertion library | Yes (expect) |
No (use Chai or Node’s assert) |
| Watch mode | Native --watch with interactive filtering |
Requires --watch flag, but less granular control |
| Code coverage | Integrated via --coverage (Istanbul) |
Add nyc separately |
| Debugger attachment | Works with --runInBand + --inspect-brk |
Works with --inspect-brk directly |
| Browser debugging | Use jest-environment-jsdom + DevTools |
Use mocha in browser with HTML reporter |
To leverage coverage effectively, run your tests with --coverage and inspect the report for uncovered branches. For each uncovered branch, write a test that forces execution through that path—even if you think the branch is trivial. Often, the act of writing that test reveals an off-by-one error, an incorrect default value, or a missing null check that was silently corrupting data. Combine this with watch mode: as you add tests, coverage percentages update in real time, guiding you toward a more robust suite. Remember, coverage is not a measure of correctness, but it is an excellent map of where your debugging attention should go next. A test suite with high branch coverage means fewer surprises in production, because every logical fork has been exercised and verified.
9. Profile Performance and Memory Leaks Like a Pro
When your application behaves correctly but feels sluggish, janky, or grows in memory over time, the bug is not in the logic—it is in the runtime. Performance and memory profiling turns vague complaints like “it’s slow” into precise, actionable data. You will learn to record real user interactions, capture CPU and network activity, and compare heap snapshots to pinpoint leaks. This is the difference between guessing and knowing.
Recording and interpreting a performance profile (CPU and network)
Open Chrome DevTools, go to the Performance panel, and click the record button (or press Ctrl+E / Cmd+E). Perform the exact user flow you want to debug—clicking, scrolling, typing—then stop the recording. The panel generates a timeline with four main tracks: Network, CPU, Frames, and Main thread. Focus on these signals:
- Red bars in the top overview indicate long tasks (over 50 ms) that block the main thread and cause jank.
- Network waterfalls show resource loading times; look for serialized requests or large payloads that delay critical rendering.
- CPU chart spikes show where computation peaks—compare it to the frame rate chart to see if dropped frames correlate with script execution.
To record a more targeted profile, use the performance API in the console to mark custom events:
performance.mark('start:render');
// ... your rendering code ...
performance.mark('end:render');
performance.measure('render duration', 'start:render', 'end:render');
console.log(performance.getEntriesByName('render duration')[0].duration);
Then filter the performance panel by “render duration” to see exactly how long that block took under real conditions.
Using heap snapshots to find detached DOM nodes and closures
Memory leaks often come from detached DOM nodes—elements removed from the document but still referenced by JavaScript—or from closures that unintentionally keep large objects alive. Open the Memory panel, select Heap snapshot, and take a baseline snapshot. Perform actions that should free memory (e.g., closing a modal, navigating away), then take a second snapshot. Use the Comparison view to see what was allocated but not released.
- Filter by Detached to find nodes with a yellow background; these are your leaks.
- Click a detached node to see the Retainers path—this shows which variable or closure holds the reference.
- Look for Closure entries in the retainers; an event listener added inside a loop often captures a parent scope unnecessarily.
A common fix is to remove event listeners when elements are destroyed. Example of a leak and its correction:
// Leaky: closure holds 'largeData' after element removal
function attachHandler(container, largeData) {
  const button = document.createElement('button');
  button.addEventListener('click', () => process(largeData));
  container.appendChild(button);
}

// Fixed: use a WeakMap or remove listener on cleanup
function attachHandlerFixed(container, largeData) {
  const button = document.createElement('button');
  const handler = () => process(largeData);
  button.addEventListener('click', handler);
  container.appendChild(button);
  // When removing the button, also call button.removeEventListener('click', handler);
}
Analyzing the flame chart to spot bottlenecks and jank
The flame chart in the Performance panel visualizes call stacks over time. Each bar is a function call; its width represents duration, and its nesting shows the call hierarchy. To find bottlenecks, look for wide, flat bars at the top of the chart—these are expensive functions. Then expand them to see if they contain nested calls that repeat unnecessarily. Common patterns:
- Layout thrashing: alternating reads and writes to the DOM forces synchronous reflows. Look for many small Recalculate Style and Layout events interleaved with script execution.
- Long event handlers: a single handler that takes 80 ms will cause visible jank; split it into smaller tasks using
requestIdleCallbackor a Web Worker. - Forced reflow: search for forced reflow warnings in the summary; they point to property accesses like
offsetHeightafter a DOM write.
After identifying a bottleneck, apply a fix and re-record the same interaction. Compare the flame charts side by side to confirm the width of the problematic function has shrunk. Profiling is an iterative process—each measurement should validate that your change actually removed the jank, not just moved it elsewhere.
10. Adopt Pro-Level Tools, Extensions, and Collaboration Practices
Mastering the mindset and core techniques of debugging is only half the battle. To truly debug JavaScript like a pro, you must weaponize your environment. The right tools turn hours of guesswork into minutes of targeted inspection, and the right collaborative habits ensure that your hard-won insights benefit the entire team—not just your own future self.
Integrating your editor’s debugger with the browser (e.g., VS Code + Chrome)
Stop switching between your editor and the browser’s DevTools. Modern editors like VS Code offer seamless, two-way debugging integration. With the built-in JavaScript debugger, you can set breakpoints directly in your source files, inspect local variables, evaluate expressions in a live console, and step through code—all without leaving your editor.
- Setup: Install the “Debugger for Chrome” or use VS Code’s built-in “JavaScript Debugger” (now default). Create a
launch.jsonconfiguration pointing to your local server URL (e.g.,http://localhost:3000). - Key benefits: You get full source maps support, meaning you can debug TypeScript, JSX, or transpiled ES6+ code in its original form. Conditional breakpoints and logpoints (which log to console without pausing) are also fully supported.
- Pro tip: Use the “Attach to Node.js” configuration for server-side debugging. This unifies your client and server debugging workflows under one interface.
This integration is a game-changer because it keeps your mental model intact. You see the actual call stack, the values of closure variables, and the exact line of execution—all within the same window where you write code.
Using framework-specific devtools for component state and props
If you’re working with React, Vue, or Angular, the generic browser console is insufficient. Framework-specific DevTools give you a structured, real-time view of your component tree, state, props, and context. This is where 80% of front-end bugs actually live.
| Framework | DevTools Extension | What it reveals |
|---|---|---|
| React | React Developer Tools | Component hierarchy, hooks state, props, context, and performance profiling. |
| Vue | Vue.js DevTools | Component tree, reactive data, computed properties, and Vuex/Pinia state. |
| Redux (any) | Redux DevTools | Action history, state diffs, time-travel debugging, and dispatcher. |
Instead of manually logging every prop or state update, you can:
- Inspect directly: Click on a component in the tree to see its current props and state. Modify state in real-time to test edge cases.
- Time-travel: In Redux, step backward and forward through dispatched actions to find the exact moment a state mutation introduced a bug.
- Filter and search: Use the component search bar to jump to a deeply nested element without scrolling through the entire tree.
These tools turn a black-box runtime into a transparent, inspectable graph. You can finally answer “Why is this prop undefined?” or “When did this state become an array?” with certainty.
Collaborative debugging: sharing traces, screenshots, and reproducible steps
Debugging is rarely a solo sport. When you’re stuck, you need to hand off the problem effectively. Vague messages like “It’s broken” waste everyone’s time. Instead, build a reproducible artifact that lets a colleague pick up exactly where you left off.
- Share console traces: Use
console.trace()or copy the full stack trace from DevTools. Include the exact error message, not a paraphrase. - Capture screenshots with context: Use browser extensions like “Full Page Screen Capture” or DevTools’ built-in node screenshot feature. Annotate the screenshot to highlight the visual bug or the failing element.
- Write a minimal reproduction: Create a CodeSandbox, StackBlitz, or a small GitHub repo that isolates the bug. Strip away all unrelated code until the issue still occurs.
- Document your findings: Maintain a team wiki or a “Debugging Log” where you record: the symptom, the suspected cause, the actual root cause, and the fix. This becomes your collective memory.
Finally, build your personal debugging toolkit: a curated set of snippets, custom console utilities (e.g., console.table for arrays), and a checklist of common pitfalls. Over time, this toolkit becomes your fastest path from “I don’t know why” to “I found it.”
Frequently Asked Questions
What is the most effective way to debug JavaScript?
The most effective way is to use a systematic approach: reproduce the bug consistently, understand the expected vs. actual behavior, and use tools like breakpoints and logging to isolate the root cause. Browser DevTools (Chrome, Firefox) provide step-through debugging, watch expressions, and call stack inspection. Combine this with a clear hypothesis-driven testing method. Avoid random console.logging; instead, set conditional breakpoints and use source maps to debug original code.
How do I debug async JavaScript code?
Async code (promises, async/await, callbacks) can be tricky. In Chrome DevTools, enable the 'Async' checkbox in the Sources panel to pause on async operations. Use 'async stack traces' to see the full call chain. For promises, use the 'Promise' breakpoints to pause on promise creation, resolution, or rejection. For event listeners, use the 'Event Listener' breakpoints. Also, use console.assert or custom logging with unique identifiers to trace async flows.
What are source maps and why are they important for debugging?
Source maps are files that map compiled or minified code back to original source code. They are essential for debugging production or transpiled code (e.g., TypeScript, Babel, webpack). Without source maps, you see minified variable names and single-line code, making debugging nearly impossible. Source maps allow DevTools to display original source, set breakpoints, and inspect variables in the original context. Always ensure your build process generates source maps for non-production or with restricted access.
How can I debug performance issues in JavaScript?
Use the Performance panel in Chrome DevTools to record and analyze runtime performance. Start by recording a profile, then look for long tasks, JavaScript execution times, and layout thrashing. Use the 'Performance Monitor' to track CPU usage, JS heap size, and DOM nodes. Identify bottlenecks like expensive loops, excessive DOM manipulation, or re-renders (in frameworks). Use the 'Flame Chart' to see function call stacks and their durations. Optimize by debouncing, memoization, or using Web Workers.
What are common JavaScript memory leaks and how to find them?
Common leaks include forgotten event listeners, detached DOM nodes, global variables, closures retaining references, and timers not cleared. Use the Memory panel in Chrome DevTools to take heap snapshots and compare them. Look for objects that grow over time. The 'Allocation instrumentation on timeline' can show where memory is allocated. Detached DOM nodes can be found by searching for objects with 'Detached' in the class name. Use the 'Heap Snapshot' to inspect retainers and paths from roots.
How do I debug React or Vue applications more effectively?
Install framework-specific DevTools: React DevTools and Vue DevTools. These allow you to inspect component props, state, hooks, and the component tree. Use the 'Profiler' in React DevTools to record renders and identify unnecessary re-renders. In Vue, use the Timeline to track component updates. Also, use source maps and the React/Vue plugins to set breakpoints in component code. Use console.log with component names and use the 'Components' panel to view state changes.
What is the 'debugger' statement and when should I use it?
The 'debugger' statement is a built-in JavaScript statement that triggers a breakpoint in any debugging tool, if available. It pauses execution at that line, allowing you to inspect variables and step through code. Use it when you want to quickly set a breakpoint without clicking in DevTools, especially in dynamic or conditional scenarios. However, remove them from production code as they can pause the browser. It's often better to use conditional breakpoints in DevTools.
How can I debug JavaScript errors that only occur in production?
Use source maps in production (but restrict access) to debug minified code. Implement error tracking tools like Sentry or LogRocket to capture stack traces and user context. Use logging at key points. Reproduce the issue using a staging environment that mirrors production. Use the 'Sources' panel to map minified code to original. Also, consider using feature flags to isolate changes. Always check for environment-specific issues like API endpoints or browser versions.
Sources and further reading
- Chrome DevTools – Sources Panel Overview
- Chrome DevTools – JavaScript Debugging Reference
- Chrome DevTools – Performance Analysis Reference
- Chrome DevTools – Memory Issues
- MDN Web Docs – Debugger Statement
- MDN Web Docs – Console API
- MDN Web Docs – JavaScript Guide
- Sentry – JavaScript Error Tracking
- LogRocket – Frontend Monitoring
- Web Fundamentals – Debugging JavaScript
Need help with this topic?
Send us your details and we will contact you.