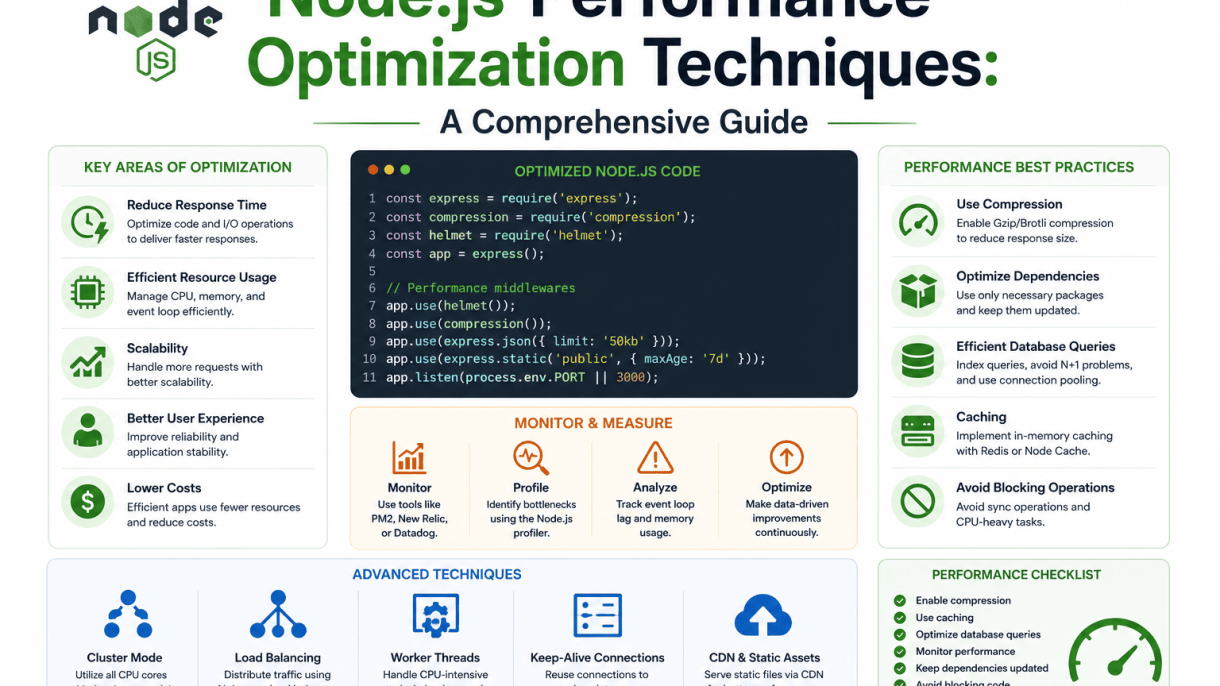

Introduction to Node.js Performance Optimization
Performance is a critical pillar of any production-grade Node.js application. A slow or unresponsive server directly degrades user experience, increases operational costs, and can lead to significant revenue loss. Node.js, built on Chrome’s V8 engine, is designed for high-throughput, non-blocking I/O operations, but it is not immune to performance degradation. Common bottlenecks include inefficient handling of I/O operations, CPU-bound tasks that block the event loop, and memory leaks that gradually exhaust system resources. Understanding these root causes is the first step toward building applications that are both fast and reliable. This guide provides a comprehensive set of techniques to diagnose and resolve these issues, ensuring your Node.js services remain performant under load.
Understanding the Event Loop and Its Impact on Performance
The event loop is the heart of Node.js, enabling asynchronous, non-blocking behavior. It continuously checks the call stack and task queues, executing callbacks, promises, and I/O handlers. However, the event loop operates on a single thread. If any synchronous, CPU-intensive operation occupies the call stack for too long—often called a “blocking operation”—the event loop cannot process pending I/O callbacks, timers, or incoming requests. This results in latency spikes and reduced throughput. Common culprits include complex JSON parsing, heavy cryptographic operations, or tight loops without yielding. To maintain performance, developers must ensure that no single synchronous task takes longer than a few milliseconds. Techniques such as offloading CPU-bound work to worker threads, using streams for large data processing, or breaking tasks into smaller chunks with setImmediate() help keep the event loop responsive.
Common Performance Pitfalls in Node.js Applications
Several recurring mistakes degrade Node.js performance. Identifying and avoiding these pitfalls is essential:
- Blocking the Event Loop: Synchronous methods like
fs.readFileSync(),JSON.parse()on large payloads, or heavyArray.sort()operations block the loop. Use asynchronous alternatives or offload to worker threads. - Memory Leaks: Unreferenced closures, retained global variables, and improperly cleaned-up event listeners cause memory to grow unbounded, leading to garbage collection pauses and eventual crashes.
- Inefficient Database Queries: N+1 queries, missing indexes, or fetching entire tables instead of specific columns overwhelm the database and increase response times.
- Unoptimized Middleware: Overly complex or synchronous middleware in Express.js can bottleneck request processing. Keep middleware lightweight and asynchronous.
- Ignoring Garbage Collection: High allocation rates and frequent garbage collection cycles can stall the event loop. Monitor heap usage and consider tuning V8 flags like
--max-old-space-size.
Measuring Baseline Performance with Profiling Tools
Before applying optimizations, establishing a performance baseline is crucial. Without metrics, improvements are guesses. Use profiling tools to identify bottlenecks precisely. Key tools and techniques include:
| Tool / Technique | Purpose | Example Command / Usage |
|---|---|---|
| Node.js built-in profiler | Records V8 CPU profiles to show function call times. | node --prof app.js then process with node --prof-process |
| Chrome DevTools | Visual profiling of CPU, heap, and event loop delays. | Start with node --inspect app.js, open chrome://inspect |
| clinic.js | High-level diagnostics for event loop, memory, and CPU. | clinic doctor -- node app.js |
| 0x | Flamegraph generation for hotspot detection. | 0x app.js |
| heapdump | Takes heap snapshots to find memory leaks. | process.kill(process.pid, 'SIGUSR2') after requiring module |
Start by profiling under a realistic load (e.g., using autocannon or wrk). Focus on metrics like average latency, throughput (requests per second), event loop lag, and heap size. A baseline reveals whether the bottleneck is CPU-bound, I/O-bound, or memory-related, guiding the choice of optimization technique. For example, high event loop lag suggests blocking operations, while rising heap size indicates a leak. Only after measurement should you proceed with targeted fixes.
Optimizing Asynchronous Code and Callbacks
Node.js thrives on non-blocking I/O, but poorly structured asynchronous code can choke the event loop and degrade throughput. Traditional callback patterns often lead to deeply nested, unreadable code—commonly known as “callback hell”—which complicates error handling and makes optimization nearly impossible. By refactoring asynchronous flows into modern patterns like Promises and async/await, you reduce overhead, improve maintainability, and keep the event loop responsive. This section covers practical techniques to eliminate callback hell, manage concurrency efficiently, and handle errors without blocking execution.
Refactoring Callbacks to Promises and Async/Await
The first step toward optimizing asynchronous code is replacing nested callbacks with Promises, then simplifying those Promises with async/await. This refactoring reduces cognitive load and allows the V8 engine to optimize execution paths more effectively. A common pattern is to wrap callback-based APIs using util.promisify or native Promise constructors.
Consider a file-read operation with nested callbacks:
const fs = require('fs');

// Callback hell version
fs.readFile('data1.txt', 'utf8', (err, data1) => {
  if (err) throw err;
  fs.readFile('data2.txt', 'utf8', (err, data2) => {
    if (err) throw err;
    // Process data1 and data2
  });
});

// Refactored with async/await
const { promisify } = require('util');
const readFile = promisify(fs.readFile);

async function readFiles() {
  try {
    const data1 = await readFile('data1.txt', 'utf8');
    const data2 = await readFile('data2.txt', 'utf8');
    // Process data1 and data2
  } catch (err) {
    console.error('Read error:', err);
  }
}
Key benefits of this refactoring include:
- Linear flow: Code reads top-to-bottom, matching synchronous logic.
- Centralized error handling: One
try/catchblock replaces scattered error checks. - Improved stack traces: Async/await preserves the call stack better than raw callbacks.
- Easier debugging: Breakpoints work naturally across asynchronous boundaries.
Managing Concurrency with Promise.all and Promise.race
When independent asynchronous tasks can run in parallel, executing them sequentially wastes throughput. Use Promise.all to run multiple operations concurrently and wait for all to complete, or Promise.race to respond to the first settled promise. This keeps the event loop busy with meaningful work rather than idle waiting.
For example, fetching multiple API endpoints simultaneously:
async function fetchUserData(userIds) {
  const fetchPromises = userIds.map(id =>
    fetch(`https://api.example.com/users/${id}`)
      .then(res => res.json())
  );

  const users = await Promise.all(fetchPromises);
  return users;
}
Consider these concurrency strategies:
| Method | Behavior | Use Case |
|---|---|---|
| Promise.all | Waits for all promises to resolve; rejects if any fail | Bulk data loads, parallel I/O operations |
| Promise.allSettled | Waits for all promises to settle (resolve or reject) | When you need results from all operations, even failures |
| Promise.race | Resolves/rejects with the first settled promise | Timeouts, fastest response selection |
| Promise.any | Resolves with the first fulfilled promise; ignores rejections | Fault-tolerant operations where any success suffices |
For large arrays of concurrent operations, consider batching with libraries like p-limit to prevent overwhelming system resources.
Handling Errors in Asynchronous Flows Without Blocking
Errors in asynchronous code can silently crash a process if uncaught, or block the event loop if handled poorly. The goal is to catch errors at the right level, propagate them cleanly, and never let an error prevent other requests from processing. Avoid throwing in Promise callbacks without a catch handler, and never use synchronous try/catch around code that returns a Promise without await.
Best practices for non-blocking error handling:
- Always await Promises inside try/catch: Unawaited Promise rejections become unhandled rejections.
- Use centralized error handlers: Attach a global
process.on('unhandledRejection')to log and gracefully exit if needed. - Return errors, don’t throw them in async functions: Prefer returning
{ error, data }objects to keep control flow predictable. - Implement timeout patterns: Use
Promise.racewith a timeout promise to prevent hanging operations from blocking the event loop.
function withTimeout(promise, ms) {
  const timeout = new Promise((_, reject) =>
    setTimeout(() => reject(new Error('Operation timed out')), ms)
  );
  return Promise.race([promise, timeout]);
}

async function fetchWithTimeout(url) {
  try {
    const data = await withTimeout(fetch(url), 5000);
    return data.json();
  } catch (err) {
    // Log error but do not crash the process
    console.error('Fetch failed or timed out:', err.message);
    return null;
  }
}
By combining these error-handling techniques, you ensure that a single failing operation does not cascade into a system-wide failure, keeping the event loop free to serve other requests.
Efficient Use of the Event Loop and Timers
Node.js operates on a single-threaded event loop, making efficient scheduling of asynchronous tasks critical for application performance. Misusing timers or deferring work incorrectly can lead to event loop starvation, where high-priority or continuous tasks prevent the loop from processing I/O callbacks, user requests, or other essential operations. Mastering the execution order of setImmediate, process.nextTick, and timer callbacks allows developers to prioritize tasks without blocking the loop.
The event loop phases process timers, pending callbacks, idle/prepare, poll, check, and close callbacks in sequence. process.nextTick callbacks execute at the end of the current operation, before the next phase begins, while setImmediate callbacks run in the check phase, after the poll phase. Timer callbacks (e.g., setTimeout) are processed in the timers phase. Understanding this hierarchy is essential for preventing microtask queues from overwhelming the loop.
Choosing Between process.nextTick and setImmediate
Both process.nextTick and setImmediate defer execution, but their placement in the event loop differs significantly. process.nextTick adds a callback to the microtask queue, which is processed immediately after the current operation—before any I/O or timer callbacks. This can cause event loop starvation if used recursively, as it prevents the loop from advancing to the next phase. setImmediate, conversely, schedules a callback for the check phase, after I/O events in the poll phase are handled, making it safer for deferring work without blocking I/O.
Use process.nextTick for critical tasks that must run before the next I/O operation, such as error propagation or ensuring a callback is invoked asynchronously. Prefer setImmediate for deferring non-urgent work, especially when scheduling multiple tasks, as it respects the event loop’s natural progression. The following table summarizes their differences:
| Feature | process.nextTick | setImmediate |
|---|---|---|
| Execution phase | End of current operation | Check phase (after poll) |
| Risk of starvation | High (recursive calls) | Low |
| Best use case | Error propagation, async guarantees | Deferred work, batching I/O |
| Order relative to I/O | Before I/O callbacks | After I/O callbacks |
In practice, avoid recursive process.nextTick loops. If you need to repeatedly defer work, use setImmediate or a timer with a delay of 0, which places the callback in the timers phase rather than the microtask queue.
Debouncing and Throttling High-Frequency Events
High-frequency events—such as user input, WebSocket messages, or data streams—can flood the event loop with callbacks, degrading responsiveness. Debouncing and throttling are two techniques to control execution rates. Debouncing ensures a callback fires only after a specified quiet period, useful for search inputs or resize handlers. Throttling limits execution to at most once per fixed interval, ideal for scroll events or real-time data updates.
Implement debouncing with setTimeout and clearTimeout to reset the timer on each event. For throttling, use a flag or timestamp check within the callback. Both techniques reduce the number of deferred tasks, preventing the event loop from being overwhelmed by microtasks or timer callbacks. When combined with setImmediate for non-urgent work, they maintain smooth I/O processing.
Avoiding Blocking the Event Loop with CPU-Intensive Tasks
CPU-intensive tasks—like JSON parsing, cryptographic operations, or image processing—can block the event loop if executed synchronously. This stops all I/O handling, timer execution, and user requests. To prevent starvation, offload heavy computation to worker threads using the worker_threads module, or use the child_process module for parallel execution. Alternatively, break the task into smaller chunks and schedule each chunk with setImmediate or setTimeout, allowing the event loop to process I/O between chunks.
For example, processing a large array in batches:
- Define a function that processes a portion of the data.
- Use
setImmediateto schedule the next batch, passing progress state. - Check elapsed time after each batch to yield control if needed.
This approach prevents a single synchronous block from starving the event loop, ensuring that incoming requests and I/O callbacks remain responsive. Always measure the impact using Node.js’ built-in diagnostic tools, such as the --trace-event-categories flag or the perf_hooks module, to verify that your scheduling strategy does not introduce latency spikes.
Memory Management and Garbage Collection Tuning
Effective memory management is critical for Node.js applications, especially those that run for extended periods. Poor memory handling can lead to increased latency, frequent garbage collection pauses, and eventual crashes. This section covers practical techniques to reduce memory footprint, identify leaks, and tune the V8 garbage collector for high-throughput workloads.
Identifying and Fixing Common Memory Leaks
Memory leaks in Node.js often arise from unintended references that prevent objects from being garbage collected. The most common sources include:
- Global variables: Storing large objects on the global scope, such as
global.cache = data, keeps them alive permanently. - Closures: Functions that capture outer scope variables can inadvertently retain large objects long after their intended use.
- Event listeners: Adding listeners without removal, particularly on EventEmitter instances, accumulates references over time.
- Timers and intervals: Unclosed
setIntervalorsetTimeoutcallbacks hold references to their scope. - Database or connection pools: Improperly managed connections that are not released back to the pool.
To detect leaks, use the --inspect flag with Chrome DevTools or the heapdump module to capture snapshots. Compare two snapshots taken at different times to identify growing objects. For automated detection, tools like clinic or memwatch-next can flag suspicious memory growth. A practical command to start debugging is:
node --inspect --expose-gc app.js
This enables the inspector and exposes the global gc() function, allowing manual garbage collection triggers during profiling.
Using WeakMaps and WeakSets for Efficient Caching
Standard Map and Set objects hold strong references to their keys, preventing garbage collection even when the key object is no longer needed elsewhere. For caching scenarios where keys are objects, this can cause memory to grow unboundedly. WeakMap and WeakSet solve this by holding weak references, meaning the garbage collector can reclaim the key-value pair when no other strong references to the key exist.
Consider a caching system for user session data:
const sessionCache = new WeakMap();

function storeSession(user, sessionData) {
  sessionCache.set(user, sessionData);
}

function getSession(user) {
  return sessionCache.get(user);
}

// When 'user' object goes out of scope or is dereferenced,
// the sessionData is automatically eligible for GC.
Use WeakMap when you need key-value associations tied to object lifetimes, such as DOM node metadata in browser-like environments or request-scoped data in server handlers. WeakSet is ideal for tracking object presence without preventing their collection, for example, marking processed items in a stream. Note that weak collections are not iterable and have no size property, so they are unsuitable for enumerating all entries.
Adjusting GC Flags for High-Throughput Workloads
V8’s garbage collector is configurable via command-line flags that can reduce pause times or improve throughput depending on your application’s needs. The default settings favor a balance, but long-running servers or real-time systems may benefit from tuning. Key flags include:
| Flag | Effect | Use Case |
|---|---|---|
--max-old-space-size=4096 |
Sets maximum heap size in MB (e.g., 4GB). | Prevent out-of-memory in memory-intensive apps. |
--gc-interval=100 |
Sets interval between GCs in milliseconds. | Force more frequent, shorter GC cycles for lower latency. |
--expose-gc |
Exposes global gc() function for manual control. |
Testing and custom GC orchestration. |
--noconcurrent_sweeping |
Disables concurrent sweeping, making GC more deterministic. | Applications needing predictable pause times. |
--optimize-for-size |
Prioritizes memory usage over speed. | Environments with strict memory limits. |
For high-throughput workloads, consider starting with --gc-interval=500 and monitoring GC pause durations via --trace-gc. Incremental and concurrent GC are enabled by default in V8 version 8.0+, but you can experiment with --max-old-space-size to give the heap more headroom, reducing the frequency of major GC cycles. Always test changes in a staging environment, as aggressive tuning can degrade performance if misapplied.
Optimizing Database and I/O Operations
Efficient database and I/O operations form the backbone of scalable Node.js applications. Poorly managed queries, connection overhead, and blocking I/O can quickly degrade performance under load. By implementing connection pooling, batching and caching strategies, and leveraging streams for large data, you can significantly reduce latency and improve throughput. The following techniques target the most common bottlenecks in database and file system interactions.
Connection Pooling with PostgreSQL and MongoDB
Creating a new database connection for every request introduces unnecessary latency and resource consumption. Connection pooling reuses a set of pre-established connections, dramatically reducing handshake overhead. For PostgreSQL, use the pg library’s built-in Pool class. Configure pool size based on your application’s concurrency needs and database limits—typically 10–25 connections per Node.js process. Example configuration:
const { Pool } = require('pg');
const pool = new Pool({
  max: 20,
  idleTimeoutMillis: 30000,
  connectionTimeoutMillis: 2000,
});
For MongoDB, the native driver and Mongoose both support connection pooling. Set maxPoolSize (default 100) and minPoolSize to match expected load. A smaller pool reduces memory but may cause queuing; a larger pool increases throughput but risks exhausting database resources. Tune these values through load testing.
| Database | Key Pool Setting | Recommended Range |
|---|---|---|
| PostgreSQL (pg) | max |
10–25 per process |
| MongoDB (native) | maxPoolSize |
50–200 per process |
Always release connections back to the pool after use—use pool.query() for PostgreSQL or rely on Mongoose’s automatic connection management. Monitor pool utilization with tools like pg-pool-stats or MongoDB Atlas metrics.
Batching and Caching Database Queries
Batching reduces round trips by grouping multiple queries into a single operation. For PostgreSQL, use pg-promise tasks or raw SQL with UNION or IN clauses. For MongoDB, use $in filters or bulkWrite() for writes. Example batching pattern in MongoDB:
const userIds = [1, 2, 3, 4, 5];
const users = await db.collection('users')
  .find({ _id: { $in: userIds } })
  .toArray();
Caching further reduces database load by storing frequently accessed data in memory. Use Redis or Node.js in-memory caches (e.g., node-cache) with a time-to-live (TTL). Implement cache-aside pattern: check cache first, query database on miss, then populate cache. Avoid caching stale or user-specific data. Key metrics to monitor:
- Cache hit ratio: target > 80% for read-heavy workloads.
- Cache miss latency: should be negligible compared to database query time.
- TTL duration: balance freshness with performance; start with 60–300 seconds.
Combine batching with caching for maximum effect—batch related queries together, then cache the aggregated result.
Using Streams for Large File Processing
Reading entire files into memory blocks the event loop and risks heap overflow. Node.js streams process data chunk by chunk, keeping memory usage constant. Use fs.createReadStream() for reading and fs.createWriteStream() for writing large files. Pipe streams to avoid manual backpressure handling:
const fs = require('fs');
const zlib = require('zlib');
const readStream = fs.createReadStream('large-file.csv');
const writeStream = fs.createWriteStream('large-file.csv.gz');
readStream.pipe(zlib.createGzip()).pipe(writeStream);
For database operations, streams can pipe query results directly to a file or HTTP response. Use MongoDB’s cursor.pipe() or PostgreSQL’s QueryStream from the pg-query-stream library. Always handle errors and close streams properly with .on('error') and .on('finish') events. Streams are ideal for:
- Log file processing (parsing, filtering, transforming).
- File uploads/downloads without buffering entire payloads.
- Database export/import operations with large datasets.
By adopting these techniques—connection pooling, batching and caching, and stream-based I/O—you can build Node.js applications that handle high concurrency and large data volumes with minimal latency and resource overhead.
Leveraging Caching Strategies
Efficient caching is one of the most impactful Node.js performance optimization techniques, as it dramatically reduces redundant computations, database queries, and network latency. By storing frequently accessed data in fast-access layers, applications can serve responses in microseconds rather than milliseconds. This section explores three critical caching approaches: in-memory caching for single-instance speed, distributed caching for horizontal scaling, and HTTP caching to offload work from the server entirely. When implemented correctly, these strategies can cut response times by 70–90% and reduce database load by orders of magnitude.
In-Memory Caching with node-cache or lru-cache
In-memory caching stores data directly in the Node.js process’s heap, offering the lowest possible latency (sub-millisecond access). Two popular libraries are node-cache (simple key-value store with TTL support) and lru-cache (Least Recently Used eviction policy for memory-bounded scenarios). Use in-memory caching for data that is read frequently, updated rarely, and fits within your server’s available RAM—such as configuration objects, reference data, or aggregated statistics.
Here is a practical example using node-cache to cache database query results:
const NodeCache = require('node-cache');
const myCache = new NodeCache({ stdTTL: 600, checkperiod: 120 });

async function getCachedUserData(userId) {
  const cacheKey = `user:${userId}`;
  let userData = myCache.get(cacheKey);
  if (userData === undefined) {
    userData = await database.query('SELECT * FROM users WHERE id = ?', [userId]);
    myCache.set(cacheKey, userData);
  }
  return userData;
}
Key considerations for in-memory caching:
- Memory limits: Use
lru-cachewith amaxoption to prevent unbounded growth. - TTL strategy: Set appropriate time-to-live values based on data freshness requirements (e.g., 5 minutes for user profiles, 1 hour for reference data).
- Cache invalidation: Manually delete or update cache entries when underlying data changes to avoid stale reads.
Distributed Caching with Redis and Cluster Mode
When your Node.js application runs across multiple processes or servers, in-memory caches become inconsistent and inefficient. Distributed caching with Redis provides a shared, network-accessible cache that all instances can read from and write to. Redis operates as an external service, typically running in cluster mode for high availability and horizontal scaling. This setup is essential for session stores, API rate limiting, and caching computed results that must be consistent across the entire application fleet.
Implement distributed caching using the ioredis library with cluster support:
const Redis = require('ioredis');
const cluster = new Redis.Cluster([
  { host: 'redis-node1', port: 6379 },
  { host: 'redis-node2', port: 6379 }
]);

async function cacheApiResponse(key, data, ttl = 300) {
  await cluster.setex(key, ttl, JSON.stringify(data));
}

async function getCachedApiResponse(key) {
  const cached = await cluster.get(key);
  return cached ? JSON.parse(cached) : null;
}
Best practices for Redis caching in Node.js:
- Connection pooling: Reuse a single Redis client instance across your application.
- Key naming conventions: Use namespaced keys (e.g.,
api:v1:users:123) to avoid collisions and simplify management. - Error handling: Always implement fallback logic to query the database if Redis is unavailable.
Setting Proper Cache Headers for API Responses
HTTP caching allows browsers and intermediate proxies (CDNs, reverse proxies) to serve cached responses without contacting your Node.js server at all. This is one of the most effective Node.js performance optimization techniques for public-facing APIs. Set the Cache-Control header to define caching rules, and use ETag or Last-Modified headers for conditional validation.
| Header | Example Value | Use Case |
|---|---|---|
Cache-Control: public, max-age=3600 |
public, max-age=3600 | Static or rarely changing data (e.g., product catalog) |
Cache-Control: private, max-age=60 |
private, max-age=60 | User-specific data (e.g., dashboard settings) |
Cache-Control: no-cache |
no-cache | Dynamic data requiring revalidation (e.g., real-time stock prices) |
Implement conditional caching with ETags in Express:
app.get('/api/products/:id', async (req, res) => {
  const product = await getProductFromCacheOrDB(req.params.id);
  const etag = `"${product.version}"`;
  if (req.headers['if-none-match'] === etag) {
    return res.status(304).end();
  }
  res.set('ETag', etag);
  res.set('Cache-Control', 'public, max-age=3600');
  res.json(product);
});
By combining these caching strategies, you reduce server load, lower latency, and improve scalability—making your Node.js application faster and more resilient under high traffic.
Node.js Performance Optimization Techniques: Clustering and Load Balancing
Node.js operates with a single-threaded event loop by default, meaning it cannot fully utilize multi-core processors without additional configuration. Clustering and load balancing are essential techniques for scaling applications across available CPU cores, improving throughput, and ensuring high availability in production environments. By distributing incoming requests across multiple worker processes, you can achieve better resource utilization and fault tolerance.
Setting Up a Cluster with the Built-in Cluster Module
Node.js provides a native cluster module that allows you to create child processes (workers) that share the same server port. The master process manages the workers, while each worker handles requests independently. Here is a basic implementation pattern:
- Master process: Creates workers based on the number of CPU cores using
os.cpus().length. - Worker processes: Run the application logic and listen on the same port via
cluster.isWorker. - Graceful restart: Listen for the
exitevent to automatically fork new workers when one crashes.
Example workflow:
| Step | Action |
|---|---|
| 1 | Check cluster.isMaster in the entry file. |
| 2 | Fork workers using cluster.fork() in a loop. |
| 3 | Each worker calls app.listen(PORT) inside cluster.isWorker. |
| 4 | Handle worker crashes by forking replacements on the exit event. |
This approach distributes connections across workers using a round-robin algorithm on Linux and macOS, while Windows uses a shared socket approach. However, the built-in module lacks advanced features like zero-downtime deployments and auto-scaling, which leads to using process managers.
Using PM2 for Zero-Downtime Reloads and Scaling
PM2 is a production-grade process manager for Node.js that simplifies clustering and adds powerful capabilities. It abstracts the cluster module, allowing you to run your application in cluster mode with a single command: pm2 start app.js -i max. Key benefits include:
- Zero-downtime reloads: Use
pm2 reload allto restart workers one by one without dropping connections. - Auto-scaling: Adjust the number of workers dynamically with
pm2 scale app +3or by settingmax_memory_restartthresholds. - Monitoring and logs: Built-in dashboard with
pm2 monitand centralized log management. - Startup scripts: Generate init scripts to keep your app running after server reboots (
pm2 startup).
PM2 also supports ecosystem configuration files (ecosystem.config.js) for defining environment variables, error handling, and deployment strategies. This makes it a preferred choice for teams managing multiple Node.js services in production.
Implementing Reverse Proxies (Nginx) for Load Distribution
While clustering handles inter-process load balancing, a reverse proxy like Nginx provides an additional layer for distributing traffic across multiple server instances, especially in multi-server deployments. Nginx sits in front of your Node.js cluster and manages incoming requests efficiently. Common strategies include:
- Round-robin: Default algorithm that distributes requests evenly across all upstream servers.
- Least connections: Sends requests to the server with the fewest active connections, ideal for variable request durations.
- IP hash: Ensures session persistence by routing requests from the same client IP to the same worker.
Example Nginx configuration for a Node.js cluster:
upstream node_cluster {
    least_conn;
    server 127.0.0.1:3000;
    server 127.0.0.1:3001;
    server 127.0.0.1:3002;
    server 127.0.0.1:3003;
}

server {
    listen 80;
    location / {
        proxy_pass http://node_cluster;
        proxy_http_version 1.1;
        proxy_set_header Upgrade $http_upgrade;
        proxy_set_header Connection 'upgrade';
        proxy_set_header Host $host;
        proxy_cache_bypass $http_upgrade;
    }
}
Nginx also provides TLS termination, static file caching, and rate limiting, reducing the load on your Node.js processes. Combining PM2’s cluster mode with Nginx as a reverse proxy creates a robust, scalable architecture that can handle high traffic volumes while maintaining reliability.
Node.js Performance Optimization Techniques: Code Optimization and Profiling
Writing performant JavaScript in Node.js requires a deep understanding of how the V8 engine optimizes and deoptimizes code. Modern profiling tools let developers pinpoint exactly where time is spent, while careful coding avoids hidden performance traps. This section covers three critical areas: avoiding deoptimization patterns, using flame graphs to identify hotspots, and benchmarking with industry-standard tools.
Avoiding Common V8 Deoptimization Patterns
V8’s just-in-time compiler aggressively optimizes functions that run frequently. However, certain patterns force the engine to bail out of optimized code, reverting to slower execution. The most common deoptimization triggers include:
- Changing object shapes (hidden classes): Adding or deleting properties after object creation forces V8 to recompile. Always assign all properties in constructors or use
Object.assignupfront. - Polymorphic function calls: Passing arguments of different types to the same function parameter. For example, calling
add(1, 2)thenadd("a", "b")deoptimizes. Use TypeScript or explicit type checks to maintain monomorphic calls. - Array hole access: Reading undefined indices in sparse arrays. Stick to contiguous, non-sparse arrays for hot paths.
- Using
try/catchinside hot functions: V8 cannot optimize functions containingtry/catch. Move error handling to a wrapper function or use structured error codes.
Profile with node --trace-deopt app.js to see exactly which functions deoptimize and why.
Using Flame Graphs to Identify Hotspots
Flame graphs provide a visual representation of where CPU time is spent. The clinic.js tool (specifically clinic flame) generates interactive flame graphs without requiring code changes. To generate a flame graph:
- Install clinic:
npm install -g clinic - Run:
clinic flame -- node app.js - Perform load testing (e.g., with autocannon) while the profiler runs.
- Analyze the resulting HTML: wide bars indicate functions consuming more time; deep stacks suggest nested calls that may be optimized.
Chrome DevTools also offers flame graphs when profiling Node.js via the --inspect flag. Open chrome://inspect, connect to the Node process, and record CPU profiles. Focus optimization efforts on the widest, most frequently called functions.
Benchmarking with autocannon and wrk
Benchmarking tools measure throughput and latency under load. Two widely used options are autocannon (Node.js-native) and wrk (C-based HTTP benchmark). The table below compares their key characteristics for Node.js optimization workflows.
| Feature | autocannon | wrk |
|---|---|---|
| Installation | npm global install | Requires compilation (make) |
| Latency percentiles | Built-in (p50, p75, p99) | Built-in (p50, p99) |
| Custom request bodies | Yes (JSON, buffers) | Limited (text file) |
| Connection reuse | HTTP/1.1 keep-alive | HTTP/1.1 keep-alive |
| Output format | Human-readable tables + JSON | Human-readable tables |
| Best use case | Node.js microservices, API routes | Raw HTTP throughput, high concurrency |
For Node.js performance tuning, autocannon integrates seamlessly with clinic.js and provides richer detail for request/response cycles. Example usage: npx autocannon -c 100 -p 10 -d 30 http://localhost:3000 (100 connections, 10 pipelined requests, 30 seconds). Compare results before and after each optimization to measure real-world gains.
Security Considerations That Affect Performance
In Node.js applications, security measures are essential but can introduce performance overhead if not implemented carefully. Input validation, rate limiting, and encryption each carry costs that can degrade throughput and increase latency. The key is to balance robust security with efficient execution, selecting optimized libraries and configuration strategies that minimize processing time while maintaining protection. This section explores how to implement these measures without sacrificing performance.
Optimizing Input Validation with Fast Libraries
Input validation is critical to prevent injection attacks and malformed data, but naive approaches—like using regular expressions on every request—can slow down response times. To optimize, choose validated libraries that compile schemas once and reuse them. Two popular choices are Joi and Ajv (Another JSON Schema Validator). Ajv is notably faster because it generates validation functions at schema compilation time, reducing per-request overhead.
Consider this practical example using Ajv:
const Ajv = require('ajv');
const ajv = new Ajv({ allErrors: false, removeAdditional: true });

const schema = {
  type: 'object',
  properties: {
    username: { type: 'string', minLength: 3, maxLength: 30 },
    email: { type: 'string', format: 'email' }
  },
  required: ['username', 'email']
};

const validate = ajv.compile(schema);

// Usage in a request handler
function handleRequest(req, res) {
  const valid = validate(req.body);
  if (!valid) {
    return res.status(400).json({ errors: validate.errors });
  }
  // Proceed with validated data
}
Best practices for optimizing input validation include:
- Compile schemas once at startup, not per request.
- Use strict validation to reject unexpected fields early.
- Limit validation scope to only necessary fields.
- Cache compiled validators in memory for reuse.
Rate Limiting with Minimal Overhead
Rate limiting protects against brute-force attacks and resource exhaustion, but in-memory stores like arrays can become bottlenecks under high concurrency. To implement rate limiting with minimal overhead, use a distributed, low-latency store such as Redis with the express-rate-limit middleware. This shifts state management off the Node.js event loop and reduces memory pressure.
Key strategies for efficient rate limiting:
- Use sliding window counters instead of fixed windows to avoid burst spikes.
- Set appropriate thresholds based on expected traffic patterns.
- Implement tiered limits (e.g., stricter for login endpoints, looser for public APIs).
- Cache rate limit checks for short durations when possible.
Comparison of rate-limit stores:
| Store | Overhead | Scalability | Use Case |
|---|---|---|---|
| In-memory (default) | Low | Single process only | Development or low-traffic apps |
| Redis | Moderate (network) | High (distributed) | Production, multi-server deployments |
| Memcached | Moderate (network) | High | Alternative to Redis |
Efficient TLS/SSL Configuration for Node.js
Encryption through TLS/SSL is mandatory for secure communication, but it can add 10-20% CPU overhead due to handshake and cipher operations. To optimize, configure Node.js to use modern, efficient cipher suites and reuse TLS sessions. The tls module allows fine-grained control.
Recommended configuration:
const tls = require('tls');
const fs = require('fs');

const options = {
  key: fs.readFileSync('server-key.pem'),
  cert: fs.readFileSync('server-cert.pem'),
  ciphers: 'TLS_AES_128_GCM_SHA256:TLS_CHACHA20_POLY1305_SHA256',
  honorCipherOrder: true,
  minVersion: 'TLSv1.2',
  sessionTimeout: 300, // seconds
  sessionCache: true
};

const server = tls.createServer(options, (socket) => {
  // Handle connection
});
Additional performance tips for TLS:
- Enable session resumption to reuse cached handshake data.
- Use hardware acceleration (e.g., OpenSSL with AES-NI) on the server.
- Terminate TLS at a reverse proxy (like Nginx) to offload CPU from Node.js.
- Select lightweight cipher suites like AES-128-GCM over AES-256-GCM when security requirements allow.
Monitoring and Continuous Performance Improvement
Optimizing Node.js performance is not a one-time task but an ongoing discipline. Once you have applied initial improvements, the next critical step is to establish a robust monitoring and continuous improvement framework. This ensures that performance gains are maintained over time, regressions are caught early, and your application remains responsive under changing loads. Without systematic monitoring, even the best optimization efforts can erode silently through code changes, dependency updates, or traffic shifts.
Integrating APM Tools (New Relic, Datadog) for Node.js
Application Performance Monitoring (APM) tools provide deep visibility into your Node.js runtime, transaction traces, and resource consumption. Integrating an APM agent like New Relic or Datadog into your Node.js application involves minimal code changes—typically adding a single require statement and configuring an API key. These tools offer several essential capabilities:
- Transaction tracing: Pinpoint slow endpoints, database queries, and external API calls with millisecond-level granularity.
- Error and exception tracking: Capture unhandled rejections, stack traces, and error rates with context.
- Garbage collection metrics: Monitor GC pauses, heap usage, and memory allocation patterns to detect leaks.
- Distributed tracing: Follow requests across microservices and asynchronous boundaries.
- Custom instrumentation: Add custom spans for business logic, queue processing, or third-party libraries.
To integrate effectively, start by instrumenting your entry point (e.g., app.js) and verify that the agent reports data in the APM dashboard. Then, set up dashboards for key Node.js metrics: event loop lag, CPU usage, memory heap, and request throughput. Both New Relic and Datadog offer pre-built Node.js dashboards that can be customized.
Automated Performance Testing in CI/CD Pipelines
Performance regression testing must be automated to catch degradations before they reach production. Integrate performance tests into your CI/CD pipeline using tools like k6, Artillery, or autocannon. A typical pipeline stage includes:
- Baseline capture: Run a performance test against a stable version of your application and record metrics (e.g., p95 latency, throughput, error rate).
- Comparison run: Execute the same test against the new build or pull request.
- Regression check: Compare key metrics against a defined threshold (e.g., p95 latency increase > 10%).
- Gate or warn: If regression exceeds the threshold, block the merge or trigger an alert.
For Node.js applications, ensure your test environment mimics production as closely as possible—same Node.js version, similar CPU/memory limits, and realistic data volumes. Use environment variables to toggle production-like settings (e.g., clustering, Redis caching). Automate test execution with scripts that run inside Docker containers or cloud CI runners.
Establishing Performance Budgets and Alerts
Performance budgets define acceptable limits for key metrics, making performance a first-class requirement. For Node.js services, typical budgets include:
| Metric | Budget Example | Alert Trigger |
|---|---|---|
| p95 HTTP response time | < 200ms | > 250ms for 5 minutes |
| Error rate (HTTP 5xx) | < 0.1% | > 0.5% for 2 minutes |
| Event loop lag | < 50ms | > 100ms for 1 minute |
| Heap memory usage | < 80% of max heap | > 90% for 3 minutes |
| CPU utilization | < 70% | > 85% for 5 minutes |
Configure alerts in your APM tool or monitoring stack (e.g., Prometheus + Alertmanager) to notify your team via Slack, PagerDuty, or email when budgets are breached. Use severity levels: warnings for slight deviations, critical alerts for sustained violations. Periodically review and adjust budgets based on actual traffic patterns and business requirements. Combine budgets with automated rollback triggers in your deployment pipeline to prevent performance-degrading releases from reaching users.
Frequently Asked Questions
What are the most effective Node.js performance optimization techniques?
The most effective techniques include using clustering to leverage multi-core systems, implementing caching (e.g., Redis or in-memory), optimizing asynchronous code with promises/async-await, profiling with tools like Chrome DevTools or clinic.js, managing memory efficiently to avoid leaks, using streams for large data, and optimizing database queries with indexing and connection pooling. Prioritize techniques based on your application's bottlenecks.
How does clustering improve Node.js performance?
Node.js runs on a single thread by default, but clustering allows you to fork multiple worker processes that share the same server port. Each worker handles requests independently, utilizing multiple CPU cores. This increases throughput and fault tolerance. The cluster module distributes incoming connections across workers, enabling horizontal scaling on a single machine. Proper load balancing ensures no single worker is overwhelmed.
What is the role of caching in Node.js performance?
Caching reduces the need to recompute or fetch data repeatedly, lowering latency and server load. In Node.js, you can use in-memory caches (e.g., node-cache) or external stores like Redis. Common caching strategies include caching database query results, API responses, and computed values. Cache invalidation is critical to ensure data freshness. Use TTL (time-to-live) and cache-aside patterns for optimal results.
How can I profile and identify bottlenecks in a Node.js application?
Use built-in tools like the Node.js profiler (–prof) or Chrome DevTools for CPU and heap snapshots. Third-party tools like clinic.js (doctor, flame) provide visual insights. Monitor event loop lag, memory usage, and garbage collection pauses. Profile specific endpoints with autocannon or wrk for load testing. Identify slow database queries, synchronous operations, or memory leaks. Regularly profile in production-like environments.
What are best practices for managing memory in Node.js?
Avoid global variables and closures that retain references. Use streams for large data instead of buffering everything. Monitor memory with process.memoryUsage(). Set appropriate –max-old-space-size for V8. Use WeakMap/WeakSet for caches to allow garbage collection. Detect leaks with heap snapshots and tools like memwatch-next. Close database connections and file handles promptly. Avoid circular references.
How do async patterns affect Node.js performance?
Proper async patterns prevent blocking the event loop. Use async/await or promises instead of callbacks to avoid callback hell and improve readability. For CPU-intensive tasks, offload to worker threads or child processes. Use Promise.all for parallel independent operations. Avoid unhandled promise rejections. Streams handle data incrementally, reducing memory overhead. These patterns keep the event loop responsive.
What are common mistakes that degrade Node.js performance?
Common mistakes include blocking the event loop with synchronous operations (e.g., fs.readFileSync), not using clustering on multi-core systems, ignoring memory leaks from closures or global variables, excessive logging, unoptimized database queries (N+1 problem), not using caching, and improper error handling that crashes processes. Also, using too many dependencies or large packages can bloat memory.
How can I optimize database queries for Node.js?
Use connection pooling (e.g., pg-pool for PostgreSQL) to reuse connections. Add indexes on frequently queried columns. Avoid SELECT *; fetch only needed fields. Use query batching and pagination for large datasets. Consider using an ORM with lazy loading or raw queries for complex joins. Cache frequent queries. Monitor slow queries with tools like MongoDB Atlas or pg_stat_statements.
Sources and further reading
- Clustering – Node.js Documentation
- Worker Threads – Node.js Documentation
- V8 Garbage Collection – V8 Developer Blog
- Chrome DevTools Memory Profiling
- clinic.js – Node.js Performance Profiling
- Node.js Event Loop – libuv Documentation
- Streams – Node.js Documentation
- Async Hooks – Node.js Documentation
- MongoDB Performance Optimization
- PostgreSQL Connection Pooling – pg-pool
Need help with this topic?
Send us your details and we will contact you.