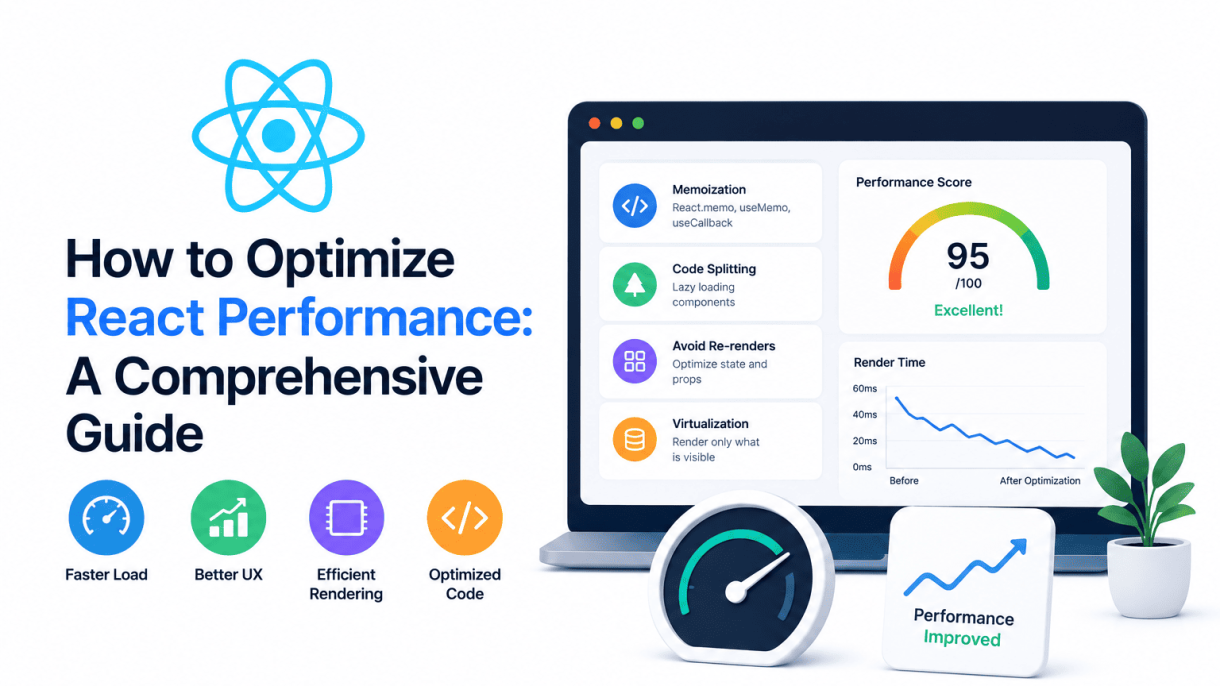

Introduction: Why React Performance Matters
In modern web development, React offers a powerful component-based architecture that enables rich, dynamic user interfaces. However, as applications grow in complexity, performance bottlenecks can emerge, degrading user experience, harming search engine rankings, and reducing conversion rates. Users expect near-instantaneous interactions; a delay of even a few hundred milliseconds can lead to frustration, increased bounce rates, and lost revenue. For React developers, understanding where these bottlenecks arise and how to address them is essential for building applications that are both fast and scalable.
Common performance issues in React include unnecessary re-renders, large component trees, inefficient data fetching, and memory leaks. These problems often manifest as sluggish page loads, janky animations, or delayed responses to user input. The impact extends beyond user satisfaction: search engines like Google factor page speed into ranking algorithms, and e-commerce sites see measurable drops in conversion rates with every additional second of load time. By proactively optimizing React performance, you can deliver a smoother experience, improve SEO performance, and ultimately drive better business outcomes.
The Cost of Unoptimized Rendering
React’s virtual DOM and reconciliation algorithm are efficient by design, but unoptimized rendering can still create significant overhead. When a component re-renders without need—due to state changes in parent components, improper use of hooks, or missing memoization—the entire subtree may re-evaluate, wasting CPU cycles and blocking the main thread. The cost is cumulative: deeper component trees and frequent re-renders compound, leading to noticeable lag. For example, a list component that re-renders every time a parent updates, even if the list data hasn’t changed, can cause visible stuttering during scrolling or typing. Over time, this can degrade the perceived performance of an entire application, making it feel heavy and unresponsive.
Key Metrics: Time to Interactive, First Paint, and Re-render Frequency
To measure and improve React performance, developers should focus on three critical metrics:
- Time to Interactive (TTI): The time it takes for a page to become fully interactive—meaning the main thread is idle and event handlers are ready. Long TTI often results from heavy JavaScript bundles, slow API calls, or blocking rendering.
- First Paint (FP) / First Contentful Paint (FCP): The moment when the browser first renders any visual content. Slow FP/FCP can occur due to large initial bundles, unoptimized images, or excessive client-side rendering.
- Re-render Frequency: The number of times components re-render in response to state or prop changes. High re-render frequency, especially in large trees, wastes resources and can cause layout thrashing or frame drops.
| Metric | What It Measures | Common Cause of Poor Score |
|---|---|---|
| TTI | Time until page is fully interactive | Large JS bundles, blocking network requests |
| FP/FCP | First visual content rendered | Slow server response, heavy initial render |
| Re-render Frequency | Number of unnecessary component updates | Missing memoization, state propagation |
Monitoring these metrics with tools like React Developer Tools, Lighthouse, or the Performance API helps identify specific areas for improvement.
Who Should Read This Guide
This guide is designed for React developers of all skill levels who want to build faster, more efficient applications. Whether you are a junior developer encountering performance issues for the first time, a mid-level engineer looking to refine your optimization techniques, or a senior architect responsible for large-scale React projects, the strategies covered here are immediately applicable. You will benefit most if you have a basic understanding of React components, hooks, and state management. If you have ever faced slow rendering, janky interfaces, or high CPU usage in your React apps, this guide will equip you with actionable solutions to diagnose and resolve these problems.
Understanding React’s Rendering Cycle
Before you can effectively optimize a React application, you must understand how React decides to update the user interface. The rendering cycle is the core mechanism that translates state changes into visual updates. Misunderstanding this cycle leads to unnecessary re-renders, wasted computation, and sluggish interfaces. This section lays the foundation for identifying and eliminating those inefficiencies.
Virtual DOM vs. Real DOM: What Happens During Re-render
The Document Object Model (DOM) is a browser API that represents the page structure. Directly manipulating the real DOM is slow because every change triggers layout recalculations and repaints. React circumvents this by maintaining a lightweight JavaScript object called the Virtual DOM.
When a component re-renders, React does not immediately touch the real DOM. Instead, it creates a new Virtual DOM tree representing the desired UI. It then compares this new tree with the previous Virtual DOM snapshot using a diffing algorithm. Only the minimal set of changes necessary to synchronize the real DOM with the new Virtual DOM are applied—a process called reconciliation. This batching and diffing dramatically reduces costly DOM operations.
The Reconciliation Algorithm and Key Props
Reconciliation is the algorithm React uses to compare two Virtual DOM trees. It operates under two key assumptions:
- Elements of different types produce different trees: If a
<div>becomes a<span>, React tears down the old subtree and builds a new one. - Elements with a stable
keyprop are reused: When iterating lists, React uses thekeyprop to match children across renders.
Without proper key props, React falls back to index-based matching, which can cause incorrect component reuse and unnecessary re-renders. For example, if you remove an item from the middle of a list, indices shift, and React may re-render every subsequent item instead of simply removing the missing one. Always use a unique, stable identifier as the key—never the array index unless the list is static and never reordered.
How State and Props Trigger Updates
React triggers a re-render when a component’s state changes (via setState or useState) or when its parent passes new props. However, the decision to re-render a component is not automatic for the entire tree. The following table summarizes when updates occur:
| Trigger | Component Behavior | Child Behavior |
|---|---|---|
| State changes | Re-renders | Re-renders unless memoized |
| Props change (new reference) | Re-renders | Re-renders unless memoized |
| Parent re-renders | Re-renders even if props are identical | Re-renders unless memoized |
Note that a parent re-render will cause all children to re-render by default, even if their props haven’t changed. This is a major source of wasted renders. You can mitigate this with React.memo for functional components or PureComponent for class components, which perform a shallow comparison of props. Consider this practical example:
// Without memo: Child re-renders every time Parent re-renders
function Child({ name }) {
  console.log('Child rendered');
  return <p>{name}</p>;
}

// With memo: Child only re-renders when name prop changes
const MemoizedChild = React.memo(Child);

function Parent() {
  const [count, setCount] = React.useState(0);
  return (
    <div>
      <button onClick={() => setCount(c => c + 1)}>Count: {count}</button>
      <MemoizedChild name="Alice" />
    </div>
  );
}
In this code, MemoizedChild avoids re-rendering when the button is clicked, because its name prop remains the same reference. Understanding these triggers is the first step toward writing performant React components.
Profiling Your React Application
Before applying any performance optimization, you must measure. Profiling provides the data-driven foundation needed to identify real bottlenecks, avoid premature optimization, and verify that your changes actually improve speed. Without profiling, you risk wasting effort on code that has no measurable impact on user experience. This section covers the essential tools and techniques for capturing performance baselines and validating improvements in React applications.
Using React Developer Tools Profiler
The React Developer Tools Profiler is the most direct way to understand component rendering behavior. It records a timeline of commits (render cycles) and shows you exactly which components rendered, why they rendered, and how long each took. To use it effectively:
- Open the Profiler tab in your browser’s DevTools after installing the React DevTools extension.
- Click the record button, interact with your application (e.g., click a button, navigate a route), then stop recording.
- Examine the flamegraph view to see component render durations; red or orange bars indicate expensive renders.
- Click on a specific commit to see which components re-rendered and their props or state changes.
Focus on components that render frequently or take more than 2-3 milliseconds per render. The Profiler also shows the “rendered by” tree, helping you trace unnecessary re-renders back to their source, such as a parent component passing new object references on every render.
Chrome DevTools Performance Tab for React Apps
While the React Profiler focuses on component lifecycle, the Chrome DevTools Performance tab captures the full browser pipeline, including JavaScript execution, layout, painting, and compositing. This is critical for identifying non-React performance issues like large DOM mutations or expensive CSS calculations. Use it as follows:
- Open the Performance tab, click “Record,” perform your user flow, then stop.
- Look at the “Main” thread flamechart for long tasks (over 50ms) that block the user interface.
- Identify JavaScript functions consuming high CPU time—these may be React reconciliation, but could also be third-party libraries or custom logic.
- Check the “Summary” tab for time spent in scripting, rendering, and painting; a high “Scripting” percentage often points to unnecessary re-renders or heavy computations.
For React apps, combine this with the React Profiler: use the Performance tab to find frame drops or jank, then drill into specific commits with the React Profiler to isolate component-level causes.
Identifying Expensive Components with Why Did You Render
Why Did You Render (WDYR) is a lightweight npm package that notifies you in the console when a component re-renders due to unchanged props or state. It helps catch unnecessary re-renders that the React Profiler might not highlight as extremely slow but which cumulatively degrade performance. To use it:
- Install
@welldone-software/why-did-you-renderand add it to your development entry point. - Wrap components with
React.memoor class components withPureComponentto enable tracking. - Set
whyDidYouRender = trueon any component you want to monitor. - Watch the console for warnings like “ComponentName re-rendered because props changed” with details about which prop changed (often a function or object reference).
WDYR is most valuable during development for catching patterns like inline arrow functions, spread operators creating new objects, or missing memoization. It does not measure duration but flags frequency and unnecessary updates.
| Tool | Primary Purpose | Best For | Limitation |
|---|---|---|---|
| React DevTools Profiler | Measure component render times and commit frequency | Identifying slow renders and re-render causes | Does not capture browser layout/paint phases |
| Chrome DevTools Performance | Analyze full browser pipeline (JS, layout, paint) | Finding frame drops, long tasks, and scripting bottlenecks | Less granularity on React component internals |
| Why Did You Render | Detect unnecessary re-renders from unchanged props/state | Catching memoization gaps and reference equality issues | No timing data; requires manual setup per component |
Use these tools in sequence: start with WDYR to eliminate obvious unnecessary re-renders, then profile with React DevTools to measure remaining expensive components, and finally use Chrome DevTools Performance to ensure optimizations translate to smoother frame rates. Always record baseline metrics before making changes, and compare after each optimization to confirm improvement.
Minimizing Unnecessary Re-renders
Unnecessary re-renders are a primary cause of sluggish React applications. When a component re-renders without any change to its props or state, it wastes computational resources and can degrade user experience, especially in complex UIs. Optimizing this area involves ensuring that components only update when genuinely needed. The key strategies involve memoization—caching the result of a render based on specific inputs—and choosing the right component architecture.
React.memo for Functional Components
For functional components, React.memo is the most direct tool to prevent unnecessary re-renders. It is a higher-order component that performs a shallow comparison of the component’s props. If the props have not changed between renders, React skips rendering the component and reuses the last rendered result.
Usage is straightforward: wrap your functional component with React.memo when you export it. This is particularly effective for components that receive complex data objects or are rendered in lists. Consider a ListItem component that receives a task object and a onToggle callback. Without memoization, every time the parent list re-renders—even if only one task changes—every ListItem re-renders. With React.memo, only the ListItem whose task object reference actually changes will re-render.
import React from 'react';

const ListItem = React.memo(({ task, onToggle }) => {
  console.log('Rendering:', task.id);
  return (
    <li>
      <input type="checkbox" checked={task.completed} onChange={() => onToggle(task.id)} />
      {task.title}
    </li>
  );
});

export default ListItem;
Note that React.memo only does a shallow comparison. If your props include functions or objects that are recreated on each parent render (like inline arrow functions), the shallow comparison will fail, and the component will still re-render. In such cases, pair React.memo</code with useCallback or useMemo in the parent to stabilize those references.
PureComponent for Class Components
For class-based components, the equivalent of React.memo is React.PureComponent. When a class component extends React.PureComponent instead of React.Component, it automatically implements a shallow comparison of props and state in its shouldComponentUpdate lifecycle method. This means that unless the props or state objects have changed reference (by shallow comparison), the component will not re-render.
This is especially useful for presentational components that display data without internal logic. For example, a UserCard class component that receives a user object and an avatar URL will only re-render when those specific references change, not when unrelated state in the parent updates.
However, be cautious: PureComponent shares the same shallow comparison limitation as React.memo. If you mutate props or state directly (e.g., this.props.user.name = 'New'), the shallow comparison will miss the change, and the component will not update. Always treat props and state as immutable.
When to Avoid Premature Memoization
While memoization is powerful, applying it indiscriminately can backfire. Each memoization wrapper (React.memo, PureComponent, useMemo, useCallback) adds overhead for the comparison itself. If a component re-renders infrequently or is very cheap to render (e.g., a simple <span>), the cost of the comparison may exceed the cost of re-rendering. In such cases, memoization harms performance.
Consider these scenarios where you should avoid premature memoization:
- Components that always receive unique props: If every render passes a new object or function reference (e.g.,
<Child key={Math.random()} />), memoization is useless because the shallow comparison always fails. - Components with trivial renders: A component that only renders static text or a single DOM element is so cheap that memoization adds unnecessary complexity.
- When you have not measured: Always profile your app first using React DevTools or browser performance tools. Apply memoization only to components that appear as bottlenecks in the profiler.
A practical rule of thumb: memoize components that are expensive to render (e.g., those with heavy calculations, large subtrees, or complex data processing) and that re-render frequently due to parent updates. For all others, start without memoization and add it only when profiling confirms a benefit.
How to Optimize React Performance: Leveraging useMemo and useCallback
In React, unnecessary re-renders can degrade performance, especially when components handle expensive computations or pass callback functions to child components. Two built-in hooks—useMemo and useCallback—help you memoize values and functions, preventing them from being recreated on every render. By strategically applying these hooks, you can reduce computational overhead and stabilize references, leading to smoother user experiences and faster load times. This section explains when and how to use each hook, along with common pitfalls to avoid.
useMemo for Heavy Computations
useMemo caches the result of a function so that it is only recalculated when its dependencies change. This is ideal for expensive calculations that do not need to run on every render, such as data filtering, sorting, or mathematical transformations.
- Basic syntax:
const memoizedValue = useMemo(() => computeExpensiveValue(a, b), [a, b]); - When to use: For operations that involve large arrays, complex loops, or heavy API processing within the render cycle.
- Example: If you have a list of thousands of items and need to filter them based on user input, wrap the filtering logic in
useMemoto avoid recalculating on unrelated state updates.
Without memoization, React re-executes the computation on every render, even if the input data hasn’t changed. This can cause noticeable lag. useMemo ensures the computation runs only when its dependencies—such as the list or filter criteria—actually update, saving CPU cycles and improving responsiveness.
useCallback to Stabilize Function References
useCallback memoizes a function reference, returning the same instance unless its dependencies change. This is crucial when passing callbacks to child components that rely on reference equality to avoid unnecessary re-renders, such as those wrapped in React.memo.
- Basic syntax:
const memoizedCallback = useCallback(() => { doSomething(a, b); }, [a, b]); - When to use: When a function is passed as a prop to a child component that uses
React.memo, or when it appears inside a dependency array of another hook (e.g.,useEffect). - Example: In a parent component that renders a list of buttons, each with an
onClickhandler. WithoutuseCallback, every parent render creates a new function reference, causing every child button to re-render even if the handler logic hasn’t changed.
By stabilizing the function reference, you prevent cascading re-renders, which is especially beneficial for deeply nested trees or components with expensive rendering logic.
Common Pitfalls and Best Practices
While useMemo and useCallback are powerful, misuse can harm performance or introduce bugs. Follow these guidelines:
| Pitfall | Why It’s Problematic | Best Practice |
|---|---|---|
| Memoizing trivial computations | Adds overhead without benefit; the cost of memoization exceeds the cost of recomputation. | Only memoize expensive operations (e.g., loops > 1000 items, complex math). |
| Overusing useCallback for inline functions | Creates unnecessary complexity and memory usage for functions that are cheap to recreate. | Use useCallback only when the function is passed to a memoized child or used in a dependency array. |
| Missing dependencies in the dependency array | Leads to stale closures and bugs because the memoized value or callback doesn’t update when needed. | Always list all variables used inside the hook. Use ESLint plugin react-hooks/exhaustive-deps to enforce this. |
| Assuming useMemo prevents side effects | useMemo is for pure computations only; side effects belong in useEffect. |
Keep memoized functions pure. Move side effects to useEffect or event handlers. |
Additionally, avoid premature optimization. Profile your app first using React DevTools or browser performance tools to identify genuine bottlenecks. Use useMemo and useCallback only where they deliver measurable improvement. Remember that these hooks themselves consume memory and processing time for dependency checks, so apply them judiciously.
By mastering useMemo and useCallback, you can fine-tune rendering behavior, reduce wasteful recalculations, and build React applications that remain fast and responsive under load.
How to Optimize React Performance: Code Splitting and Lazy Loading
Code splitting and lazy loading are essential techniques to reduce your application’s initial bundle size, leading to faster load times and improved user experience. By breaking your JavaScript into smaller chunks and loading them only when needed, you avoid forcing users to download code they may never execute. This section explores practical methods to implement these optimizations in React.
React.lazy and Suspense for Component-Level Splitting
React provides built-in support for component-level code splitting through React.lazy and Suspense. React.lazy allows you to dynamically import a component as a separate chunk, while Suspense renders a fallback UI while the chunk loads. This is ideal for components that are not immediately visible, such as modals, heavy charts, or rarely used forms.
Here is a practical example showing how to lazy load a chart component:
import React, { Suspense } from 'react';

const HeavyChart = React.lazy(() => import('./HeavyChart'));

function Dashboard() {
  return (
    <div>
      <h2>Performance Dashboard</h2>
      <Suspense fallback={<div>Loading chart...</div>}>
        <HeavyChart />
      </Suspense>
    </div>
  );
}
Key points to consider when using this approach:
- Only wrap components that are large or rarely used to avoid unnecessary overhead for small imports.
- Provide a meaningful fallback UI to maintain user engagement during loading.
- Avoid using
React.lazyinside loops or conditional statements where the import may fail unpredictably.
Route-Based Splitting with React Router
Route-based splitting leverages your application’s navigation structure to load code only for the active route. This is particularly effective for single-page applications with multiple pages. Using React Router, you can combine React.lazy with route definitions to create separate bundles for each route.
Implement route-based splitting as follows:
- Define routes using
React.lazyfor each page component. - Wrap all routes in a single
Suspensecomponent to handle loading states globally. - Ensure fallback UI is consistent across routes, such as a spinner or skeleton.
Comparison of route-based splitting versus component-level splitting:
| Technique | Best Use Case | Granularity | Impact on Bundle |
|---|---|---|---|
| Route-Based Splitting | Entire pages or views | Coarse (per route) | Reduces initial load by deferring entire pages |
| Component-Level Splitting | Specific heavy components | Fine (per component) | Reduces initial load by deferring isolated parts |
Dynamic Imports for Libraries and Polyfills
Third-party libraries and polyfills often contribute significantly to bundle size. Dynamic imports allow you to load these dependencies only when they are actually needed. For example, a date picker library can be imported only when the user opens a date input, or a polyfill can be loaded only for older browsers.
Practical steps for dynamic library imports:
- Identify libraries used in conditional features, such as charts, maps, or rich text editors.
- Replace static imports with dynamic
import()calls inside the relevant component or function. - For polyfills, use feature detection to determine if loading is necessary, then import conditionally.
Example of loading a library dynamically based on user interaction:
function handleOpenDatePicker() {
  import('react-datepicker').then((DatePicker) => {
    // Render the date picker component
  });
}
By applying these three techniques—component-level splitting with React.lazy and Suspense, route-based splitting with React Router, and dynamic imports for libraries—you can significantly reduce your app’s initial payload, improve time-to-interactive, and deliver a smoother experience for your users.
Optimizing Lists and Large Data Sets
Rendering long lists, tables, or grids in React can quickly degrade performance because React must reconcile thousands of DOM nodes on every state or prop change. Without optimization, even simple updates can cause noticeable lag, jank, or unresponsive interfaces. Effective optimization focuses on reducing the number of rendered elements and minimizing reconciliation work. Two foundational techniques are virtualization—rendering only the visible portion of a data set—and ensuring stable, unique keys for list items. Additionally, controlling the rate of user input that triggers list updates prevents unnecessary re-renders.
Windowing with react-window and react-virtualized
Windowing (also called virtualization) is the most impactful technique for rendering large data sets. Instead of rendering all items in a list, windowing libraries render only the subset currently visible in the viewport, plus a small buffer above and below. This dramatically reduces DOM node count and memory usage. Two popular React libraries are react-window and react-virtualized.
- react-window: A lightweight, modern library ideal for most use cases. It provides components like
FixedSizeList(for uniform item heights) andVariableSizeList(for varying heights). It has a smaller API surface and better performance for common scenarios. - react-virtualized: An older, more feature-rich library that includes advanced components like
AutoSizer,CellMeasurer, andInfiniteLoader. It is heavier than react-window but better suited for complex layouts, such as grids with resizable columns or dynamic row heights.
When choosing between them, prefer react-window for new projects unless you need its advanced features. Implementation is straightforward: replace a mapped list with the virtualized component, passing the total item count, item size, and a render function for each visible row.
Using Stable and Unique Keys
Keys are essential for React to identify which items have changed, been added, or removed. Without stable keys, React may unnecessarily re-render all items, causing performance degradation. Follow these rules:
- Use unique, stable identifiers: Prefer IDs from your data (e.g., database primary keys) over array indices. Indices can cause issues when items are reordered, filtered, or inserted.
- Avoid non-unique keys: Duplicate keys lead to unpredictable behavior and broken UI updates.
- Never use random values or timestamps: These change on every render, forcing React to unmount and remount all items, destroying state and causing significant overhead.
For example, if each item in a list has a user.id, use that as the key:
<ul>
  {users.map(user => (
    <li key={user.id}>{user.name}</li>
  ))}
</ul>
If IDs are unavailable and the list is static (no reordering or filtering), you may use the index as a last resort, but this is rare and discouraged.
Debouncing and Throttling User Input for Large Lists
When user input (e.g., typing in a search box, scrolling, or resizing) triggers updates to a large list, rapid events can cause excessive re-renders. Debouncing and throttling control the rate of execution:
| Technique | Behavior | Use Case |
|---|---|---|
| Debouncing | Delays execution until after a specified pause since the last event. Ideal for input where you want to wait until the user stops typing. | Search input filtering a large list |
| Throttling | Ensures execution occurs at most once per specified interval. Useful for events that fire continuously, like scrolling or resizing. | Infinite scroll loading more items |
Implement these with a custom hook or a library like Lodash. For example, debounce a search handler by 300ms to avoid filtering the list on every keystroke. Throttle a scroll handler to check visibility of new items every 200ms. Combined with virtualization, these techniques ensure smooth interaction even with tens of thousands of rows.
State Management and Data Fetching Strategies
Optimizing React performance requires careful attention to how state is structured, stored, and retrieved. Poor state management leads to unnecessary re-renders, wasted computation, and sluggish user interfaces. Data fetching patterns also play a critical role: inefficient requests, missing cache layers, and stale data can degrade both perceived and actual performance. By adopting disciplined state architecture and modern data fetching libraries, you can significantly reduce render cycles and improve responsiveness.
Normalizing State for Selectors and Memoization
Storing state in deeply nested or redundant structures forces selectors to perform expensive deep comparisons and re-creates references on every update. Normalizing state—flattening nested data into collections keyed by ID—enables selectors to retrieve only the exact pieces needed. This pattern pairs naturally with memoization libraries such as Reselect or the built-in useMemo hook.
- Store entities in a dictionary (e.g.,
{ users: { byId: {}, allIds: [] } }) rather than nested arrays. - Write small, composable selector functions that derive data from normalized stores.
- Use memoized selectors to prevent recomputation when unrelated slices of state change.
- Avoid storing derived data in state; compute it in selectors with memoization.
For example, a normalized posts state avoids re-rendering a list component when only a single post’s author name changes, because the selector for the list only depends on the allIds array and not on individual post content. This reduces render work from O(n) to O(1) for unrelated updates.
Using React Query or SWR for Caching and Background Refetching
Client-side data fetching libraries like TanStack React Query and SWR eliminate common performance pitfalls: redundant network requests, missing cache layers, and synchronous waterfall fetches. Both libraries cache responses in memory, automatically deduplicate concurrent requests, and support stale-while-revalidate patterns for background updates.
| Feature | React Query (TanStack Query) | SWR (Vercel) |
|---|---|---|
| Cache strategy | In-memory cache with configurable stale time and garbage collection | In-memory cache with stale-while-revalidate by default |
| Background refetch | Configurable on window focus, interval, or mutation | Automatic on window focus and configurable interval |
| Pagination support | Built-in with useInfiniteQuery and page parameter management |
Manual implementation required or via plugins |
| Devtools | Full-featured dedicated devtools | Basic devtools available |
| Optimistic updates | First-class support with rollback logic | Supported via mutate and rollback callbacks |
Using either library reduces the need for global state to hold server data, because the cache acts as a single source of truth. This eliminates prop drilling of fetched data through multiple component layers and prevents components from re-fetching data that has not changed.
Avoiding Prop Drilling with Context and Zustand
Prop drilling—passing data through many intermediate components—causes unnecessary re-renders because every intermediate component must accept and forward the props, even if they do not use them. Context API provides a built-in solution, but naive usage can cause performance issues: any change to context value re-renders all consumers, even those that only read unrelated properties.
To mitigate this:
- Split contexts by domain (e.g.,
AuthContext,ThemeContext,UserPreferencesContext) to limit re-render scope. - Use
useMemoto stabilize context values and avoid re-creating objects on every render. - For complex state with frequent updates, consider Zustand instead of Context. Zustand uses a subscription-based model: components only re-render when the specific slice they subscribe to changes, eliminating the broadcast re-render problem of Context.
Zustand stores are lightweight (under 1 KB) and require no provider wrappers, making them ideal for performance-critical applications. A common pattern is to combine Zustand for client-side UI state (e.g., modals, filters, form inputs) with React Query for server data, resulting in a clean separation of concerns and minimal re-render overhead.
Image and Asset Optimization
Images, fonts, and static assets often account for the majority of a React application’s download size. Without deliberate optimization, these resources can delay interactivity, increase bandwidth usage, and cause jarring layout shifts. Effective asset optimization reduces load times while preserving visual quality, directly improving Core Web Vitals and user retention. The following techniques focus on deferring non-critical resources, leveraging modern image formats, and managing font loading to maintain a stable layout.
Lazy Loading Images with Intersection Observer
Lazy loading defers offscreen images until the user scrolls near them, preventing unnecessary network requests and reducing initial page weight. The Intersection Observer API provides a performant, native way to detect when an element enters the viewport. Unlike scroll-event-based methods, it runs asynchronously and does not block the main thread.
Implement a custom React hook or component that observes each <img> element:
import { useEffect, useRef, useState } from 'react';

function LazyImage({ src, alt, ...props }) {
  const imgRef = useRef(null);
  const [loaded, setLoaded] = useState(false);

  useEffect(() => {
    const observer = new IntersectionObserver(
      ([entry]) => {
        if (entry.isIntersecting) {
          setLoaded(true);
          observer.disconnect();
        }
      },
      { rootMargin: '200px' } // Start loading 200px before visible
    );
    if (imgRef.current) observer.observe(imgRef.current);
    return () => observer.disconnect();
  }, []);

  return (
    <img
      ref={imgRef}
      src={loaded ? src : undefined}
      alt={alt}
      {...props}
    />
  );
}
Key benefits of this approach:
- Reduces initial HTTP requests by 40–60% for image-heavy pages.
- Works with any image format, including WebP and AVIF.
- No external library dependency—Intersection Observer is supported in all modern browsers.
Using Next.js Image Component or Responsive Images
For React applications built with Next.js, the built-in next/image component automates responsive image handling, lazy loading, and format optimization. It serves appropriately sized images based on the device’s viewport and pixel density, and it uses the browser’s native lazy loading as a fallback.
Example usage:
import Image from 'next/image';

function Hero() {
  return (
    <Image
      src="/hero.webp"
      alt="Hero banner"
      width={1200}
      height={600}
      priority={false} // Set true for above-the-fold images
    />
  );
}
If you are not using Next.js, implement responsive images manually with the srcset and sizes attributes:
- Generate multiple image versions at different widths (e.g., 480px, 768px, 1200px).
- Use modern formats (WebP, AVIF) with a fallback via
<picture>. - Set
loading="lazy"on all non-critical images.
This approach ensures that mobile devices download smaller files while desktops receive higher resolution, reducing total image payload by up to 30%.
Optimizing Font Loading to Prevent Layout Shift
Custom fonts often cause Cumulative Layout Shift (CLS) when the browser swaps from a fallback font to the loaded font. To minimize this, use the font-display: optional CSS property, which gives the font a short block period (100ms) and then uses the fallback if the font hasn’t loaded. This prevents invisible text and layout shifts entirely for most users.
Best practices for font loading:
- Self-host fonts instead of relying on third-party CDNs to reduce DNS lookups and connection overhead.
- Preload the primary font file using
<link rel="preload">in the HTML<head>. - Subset fonts to include only the characters your application uses (e.g., Latin, common symbols).
- Use WOFF2 format, which is 30% smaller than WOFF.
Example preload link for a self-hosted font:
<link
  rel="preload"
  href="/fonts/inter.woff2"
  as="font"
  type="font/woff2"
  crossorigin
/>
By combining font-display with preloading and subsetting, you can reduce CLS to near zero while maintaining typographic integrity. This technique is especially important for text-heavy React applications where fonts are loaded dynamically.
Build and Deployment Optimizations
Even the most efficiently coded React application can underperform if its build and deployment pipeline is not optimized. The final step in delivering a fast user experience involves configuring production builds, analyzing bundle composition, and leveraging content delivery networks. This section covers the critical techniques to ensure your React app loads as quickly as possible for end users.
Production Build Flags and Tree Shaking
React applications are typically developed with extensive debugging and warning messages, which add unnecessary weight to the final bundle. For production, you must enable the correct build flags to strip out these development-only features. When using Create React App, the npm run build command automatically sets NODE_ENV=production, which enables React’s production mode. For custom Webpack configurations, ensure you are using the DefinePlugin to set process.env.NODE_ENV to "production". This single flag removes prop-type validation and development warnings, significantly reducing bundle size.
Tree shaking, the process of eliminating unused exports, is automatically performed by Webpack 4+ and Rollup when using ES module syntax (import and export). To maximize its effectiveness:
- Always use ES module imports (e.g.,
import { useState } from 'react') instead of CommonJSrequire()calls. - Avoid importing entire libraries; import only the specific functions or components you need.
- Configure side-effect flags in
package.jsonif your library has no side effects (e.g.,"sideEffects": false). - Use the
optimization.usedExportsoption in Webpack to mark unused exports.
Analyzing Bundle Size with Webpack Bundle Analyzer
Before you can optimize, you must measure. The Webpack Bundle Analyzer plugin provides an interactive treemap visualization of your bundle’s contents. To integrate it, install the package and add it to your Webpack plugins array. The plugin generates a zoomable, interactive HTML file that shows each module’s relative size. Use this tool to identify:
- Large third-party libraries that may be replaced with lighter alternatives.
- Duplicate dependencies caused by version mismatches in
node_modules. - Unused code that tree shaking failed to remove due to improper imports.
- Large assets like images or fonts embedded directly in JavaScript.
After analysis, consider code splitting with React.lazy() and dynamic import() to break your bundle into smaller chunks that load on demand. This technique is especially effective for routes or heavy components that are not immediately visible.
Serving Assets via CDN and Enabling Compression
Once your build is lean, deliver it efficiently. A Content Delivery Network (CDN) distributes your static assets across geographically distributed servers, reducing latency for users worldwide. For React applications, host the build/ folder on a CDN like Cloudflare, AWS CloudFront, or Netlify. Ensure your build script outputs files with content hashes in filenames (e.g., main.a1b2c3.js) to enable long-term caching and cache invalidation on updates.
Compression is equally critical. Enable gzip or Brotli compression on your CDN or web server. Brotli typically achieves 20–30% better compression ratios than gzip for JavaScript and CSS files. Verify compression is active by checking the Content-Encoding response header in your browser’s developer tools. Combine compression with proper cache headers (Cache-Control: public, max-age=31536000, immutable for hashed assets) to ensure returning visitors load your app from their local cache without network requests.
Finally, preload critical assets using <link rel="preload"> tags in your HTML for fonts and key JavaScript files, and use <link rel="preconnect"> for CDN origins to reduce connection setup time.
Frequently Asked Questions
What is React performance optimization?
React performance optimization involves techniques to reduce unnecessary re-renders, minimize bundle size, and improve initial load time. Key methods include using React.memo for functional components, useMemo and useCallback for expensive computations, code splitting with React.lazy and Suspense, and profiling with the React DevTools Profiler. These practices ensure your app runs smoothly, especially on lower-end devices or slow networks.
How does React.memo improve performance?
React.memo is a higher-order component that memoizes the rendered output of a functional component. It performs a shallow comparison of props and only re-renders if props have changed. This prevents unnecessary renders when parent components update but the child’s props remain the same. Use it for components that render often with the same props, but avoid overusing it on simple components where the comparison cost outweighs benefits.
What is code splitting in React?
Code splitting is a technique that breaks your bundle into smaller chunks loaded on demand. React supports this via dynamic import() and React.lazy for components, combined with Suspense for fallback UI. This reduces initial bundle size, speeding up first paint. Tools like Webpack and Vite automatically split code at route or component boundaries. Best practice is to split large libraries and rarely-used components.
How does the React Profiler help?
The React Profiler (available in React DevTools) records render timing and identifies components that render too often or take too long. You can inspect flamegraphs to see commit phases and render durations. This helps pinpoint performance bottlenecks—like expensive computations or unnecessary re-renders—so you can apply targeted optimizations like memoization or restructuring state.
What is the virtual DOM and how does it affect performance?
The virtual DOM is a lightweight JavaScript representation of the real DOM. React uses it to batch updates and compute the minimal set of changes needed, reducing direct DOM manipulation. While efficient, unnecessary re-renders still occur if state or props change. Optimizations like key props in lists, shouldComponentUpdate, and React.memo help minimize virtual DOM diffing overhead.
When should I use useMemo vs useCallback?
useMemo memoizes the result of a function (e.g., expensive calculations), while useCallback memoizes the function itself to prevent re-creation on every render. Use useMemo for derived data that requires computation, and useCallback for passing stable callbacks to child components that rely on reference equality (e.g., with React.memo). Avoid overusing both; only apply when you can measure a performance gain.
How do I reduce bundle size in a React app?
Reduce bundle size by: (1) code splitting with React.lazy and dynamic imports, (2) tree shaking unused exports via ES modules, (3) using production builds with minification, (4) replacing large libraries with smaller alternatives (e.g., date-fns over moment.js), (5) lazy loading images and non-critical assets, (6) analyzing bundles with tools like Webpack Bundle Analyzer. Also consider server-side rendering or static generation for faster initial loads.
What are common React performance anti-patterns?
Common anti-patterns include: (1) creating new objects or functions in render (breaks memoization), (2) using inline arrow functions in JSX without need, (3) storing computed values in state instead of deriving them, (4) excessive use of context that causes many re-renders, (5) not using keys in lists or using index as key, (6) over-optimizing with premature memoization. Profile first to identify real bottlenecks.
Sources and further reading
- React Profiler API
- React.memo Documentation
- useMemo Hook Reference
- useCallback Hook Reference
- Code Splitting in React
- Web Vitals: Core Web Vitals Overview
- Webpack: Code Splitting Guide
- Vite: Code Splitting Documentation
- Chrome DevTools: Performance Features
- React DevTools: Profiler
Need help with this topic?
Send us your details and we will contact you.