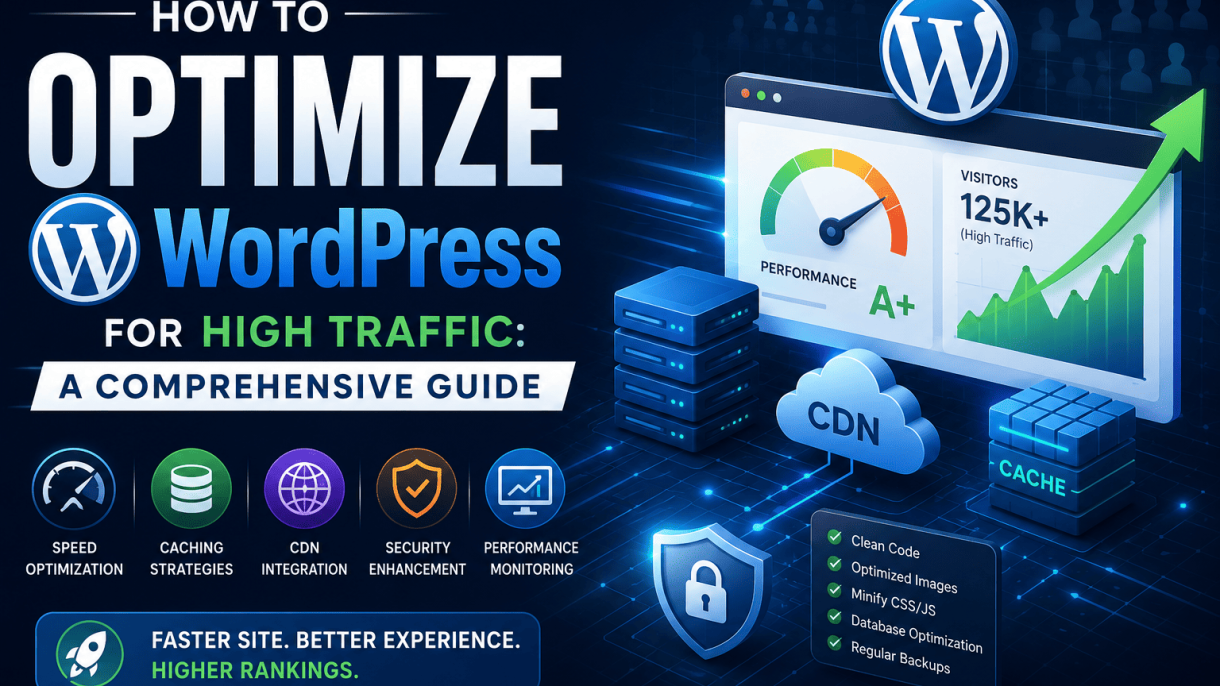

Understanding Your Traffic Baseline and Goals
Before diving into any optimization strategy, you must first understand where your WordPress site currently stands. Optimizing for high traffic without a clear baseline is like navigating without a map—you may improve, but you cannot measure success or identify failures. This foundational step ensures that every subsequent action—from caching to database tuning—targets real bottlenecks and aligns with your growth objectives. Begin by assessing three critical dimensions: current traffic patterns, server resource utilization, and existing performance metrics. Only then can you set realistic, data-driven goals that prevent wasted effort and unexpected downtime during traffic spikes.
Analyzing Your Current Traffic with Analytics Tools
To know your traffic baseline, you need reliable data. The most widely used tool is Google Analytics, which provides comprehensive insights into visitor behavior, page views, session duration, and geographic distribution. Install it via a plugin like MonsterInsights or Site Kit by Google, or add the tracking code directly to your theme’s header. For real-time monitoring, consider server-side analytics tools like Matomo (self-hosted) or Clicky, which offer granular data without ad-blocker interference. Key metrics to track include:
- Total monthly visitors and pageviews: Understand volume trends over weeks or months.
- Average session duration and pages per session: Gauge engagement depth.
- Bounce rate: High bounce rates may indicate slow loading or irrelevant content.
- Traffic sources: Identify whether visitors come from organic search, social media, direct links, or referrals.
- Device breakdown: Mobile vs. desktop traffic influences caching and image optimization priorities.
Additionally, use your web host’s control panel (e.g., cPanel’s Awstats or Webalizer) or a dedicated server monitoring tool like New Relic to cross-reference analytics data with server resource usage—CPU, memory, and disk I/O. This triangulation reveals whether traffic spikes correlate with resource strain, helping you distinguish between normal growth and infrastructure limitations.
Identifying Peak Traffic Periods and Bottlenecks
Once you have traffic data, pinpoint when your site experiences the highest load. Plot daily and weekly visitor counts using Google Analytics’ “Hourly” report or a custom dashboard. Common patterns include predictable spikes from scheduled blog posts, email campaigns, or seasonal events. For example, an e-commerce site might see surges on Black Friday, while a news site peaks during breaking stories. To identify bottlenecks, look beyond traffic volume:
- Server response time (TTFB): A high Time to First Byte during peak hours indicates server overload or slow database queries.
- Error rates: Spikes in 500 or 503 errors suggest resource exhaustion or misconfigured caching.
- Plugin conflicts: Test disabling non-essential plugins during low traffic to see if performance improves.
- Database query load: Use Query Monitor plugin to find slow queries that spike under concurrent users.
- CDN utilization: Check if your content delivery network handles static assets efficiently or if origin servers are overwhelmed.
Create a timeline of these events: note the date, time, traffic volume, and any corresponding server alerts. For instance, if your site slows down every Tuesday at 10 AM, cross-reference that with scheduled cron jobs or backup routines. This detective work often reveals hidden bottlenecks, such as a poorly optimized plugin that runs heavy queries during peak hours or a caching layer that fails to serve stale content during surges.
Setting Performance Benchmarks and KPIs
With baseline data and bottleneck insights, establish clear, measurable performance goals. Avoid vague targets like “make the site faster.” Instead, define specific Key Performance Indicators (KPIs) that reflect user experience and server capacity. Common benchmarks for high-traffic WordPress sites include:
| KPI | Target Range | Why It Matters |
|---|---|---|
| Page load time | Under 2 seconds (ideally <1s) | Directly impacts bounce rate and SEO rankings. |
| Time to First Byte (TTFB) | Under 200ms | Indicates server and network efficiency. |
| Requests per page | Fewer than 50 | High request count strains server and browser. |
| Peak concurrent users | 500–5,000+ (varies by host) | Determines when you need scaling solutions. |
| Database query time | Under 0.5 seconds per query | Slow queries cause cascading delays. |
| Error rate (HTTP 5xx) | Below 0.1% during peak | High errors indicate instability. |
Set your benchmarks based on your current hosting environment and traffic level. For example, if your baseline TTFB is 800ms, a realistic first goal might be 400ms after implementing a CDN and caching plugin. Similarly, if your site crashes at 1,000 concurrent users, aim to support 2,000 users with optimized caching and a faster database. Use tools like GTmetrix, WebPageTest, or Lighthouse to measure these KPIs regularly, and document your progress weekly. Remember that benchmarks should evolve as traffic grows—review and adjust every quarter to reflect new infrastructure or content changes.
Finally, prioritize KPIs that directly affect user experience and revenue. For an e-commerce site, “add-to-cart success rate during peak traffic” may be more critical than raw page load time. For a blog, “time to interactive” and “first contentful paint” matter most. By tying KPIs to business goals, you ensure that optimization efforts deliver tangible value rather than just technical improvements. With a clear baseline, identified bottlenecks, and measurable targets, you are now ready to implement the technical optimizations that will scale your WordPress site for high traffic.
How to Optimize WordPress for High Traffic: Choosing a High-Performance Hosting Provider
When your WordPress site begins to attract significant traffic, the foundation of your performance lies in the hosting provider you choose. A high-traffic site demands more than just basic uptime; it requires a hosting environment that can scale seamlessly, allocate dedicated resources, integrate content delivery networks (CDNs), and provide robust technical support. Without a properly optimized hosting setup, even the most efficient code and caching strategies will falter under load, leading to slow page speeds, downtime, and lost revenue. This guide explores how to select a hosting solution that meets these demands, focusing on three critical areas: comparing hosting types, evaluating managed WordPress features, and understanding cloud scalability.
Comparing Shared, VPS, and Dedicated Hosting Options
The first step in optimizing WordPress for high traffic is understanding the tiered hosting landscape. Each option—shared, VPS, and dedicated—offers distinct trade-offs in cost, performance, and control. Below is a breakdown of their key characteristics:
| Hosting Type | Resource Allocation | Performance Under Load | Scalability | Best For |
|---|---|---|---|---|
| Shared Hosting | Shared CPU, RAM, and disk space among many sites | Poor; traffic spikes can cause slowdowns or crashes | Very limited; upgrading often requires migration | Low-traffic personal blogs or small businesses |
| VPS (Virtual Private Server) | Dedicated virtual resources (CPU, RAM) within a shared physical server | Good; consistent performance with isolated resources | Moderate; can scale vertically by increasing plan resources | Growing sites with moderate traffic (e.g., 10k–100k visits/month) |
| Dedicated Hosting | Entire physical server reserved for one client | Excellent; maximum control and no resource contention | High; but requires manual upgrades or server swaps | High-traffic sites (e.g., 100k+ visits/month) or resource-intensive applications |
For high-traffic WordPress sites, shared hosting is rarely viable due to its lack of resource isolation. VPS hosting offers a cost-effective middle ground, providing dedicated resources that prevent other sites from draining your server capacity. However, as traffic grows, dedicated hosting becomes necessary for mission-critical sites where peak loads must be handled without compromise. When comparing these options, always check the provider’s resource limits—look for guaranteed CPU cores, RAM, and I/O throughput, not just advertised “unlimited” plans that often throttle during high usage.
Evaluating Managed WordPress Hosting Features
Managed WordPress hosting is a specialized solution designed to optimize performance, security, and maintenance for WordPress sites. For high-traffic environments, it offers several advantages over generic hosting. Key features to evaluate include:
- Server-Level Caching: Built-in page caching, object caching (e.g., Redis or Memcached), and opcode caching (e.g., OPcache) reduce database queries and server load. Look for providers that integrate with WordPress plugins like WP Super Cache or W3 Total Cache at the server level.
- Automatic Scaling: Some managed hosts can dynamically allocate additional resources during traffic spikes, preventing downtime without manual intervention. This is critical for viral content or seasonal surges.
- CDN Integration: A content delivery network distributes static assets (images, CSS, JavaScript) across global edge servers, reducing latency for international visitors. Many managed hosts include free CDN credits or seamless integration with providers like Cloudflare or StackPath.
- Automated Backups and Updates: Daily backups and one-click WordPress core, theme, and plugin updates ensure your site remains secure and recoverable, even under heavy load.
- Staging Environments: Test performance changes or plugin updates in a sandboxed environment before deploying to production, avoiding disruptions to live traffic.
- Expert Support: 24/7 support teams specialized in WordPress can diagnose performance bottlenecks, such as slow database queries or plugin conflicts, faster than generic hosting support.
When evaluating managed WordPress hosts, request performance benchmarks or trial periods. Test how the platform handles a simulated traffic spike using tools like Load Impact or K6. Also, examine the fine print for resource caps—some providers limit PHP workers or database connections, which can throttle high-traffic sites. Prioritize hosts that offer transparent resource limits and clear upgrade paths.
Key Considerations for Cloud and Scalable Hosting
Cloud hosting represents the most flexible and scalable option for high-traffic WordPress sites. Unlike traditional hosting that relies on a single server, cloud platforms distribute your site across a network of virtual servers, enabling rapid scaling and high availability. When optimizing for traffic, consider these factors:
- Elastic Scalability: Cloud providers like AWS, Google Cloud, or digitalOcean allow you to add or remove resources (CPU, RAM, storage) in real-time based on demand. For WordPress, this means you can handle a sudden spike from a Reddit post without pre-planning server upgrades.
- Load Balancing: Distribute incoming traffic across multiple server instances to prevent any single point of failure. A load balancer can automatically route users to the healthiest server, improving response times and uptime.
- Auto-Scaling Groups: Configure rules to automatically spin up new server instances when CPU usage exceeds a threshold (e.g., 70%). This ensures your site remains responsive during traffic surges and scales down to save costs during lulls.
- Database Optimization: High-traffic WordPress sites often bottleneck at the database level. Consider using a managed database service (e.g., Amazon RDS or Google Cloud SQL) with read replicas to offload query load from the primary database. Implement object caching with Redis to reduce database queries for frequently accessed data.
- CDN and Edge Caching: Cloud hosting pairs naturally with CDNs. Use a CDN to cache entire HTML pages at edge locations, reducing server load by up to 90% for static content. Services like Cloudflare’s APO (Automatic Platform Optimization) can further optimize WordPress-specific dynamic content.
- Cost Management: Cloud hosting’s pay-as-you-go model can become expensive if not monitored. Set budget alerts, use reserved instances for baseline traffic, and leverage spot instances for non-critical tasks like image processing. Many providers offer cost calculators to estimate monthly spend based on traffic projections.
To implement cloud hosting for WordPress effectively, consider using a platform-agnostic tool like Kinsta or WP Engine that abstracts cloud complexity, or build a custom stack using Terraform and Ansible for full control. Regardless of the approach, ensure your hosting provider offers a robust API for automating scaling events, such as integrating with monitoring tools like New Relic or Datadog. Finally, test your cloud setup with a stress test tool like Apache JMeter to verify that scaling triggers work correctly and that your site maintains sub-second load times under peak traffic.
By carefully selecting a high-performance hosting provider that matches your traffic patterns—whether through managed WordPress features, dedicated resources, or cloud scalability—you lay a solid foundation for handling high traffic without compromising user experience. The right hosting choice will not only keep your site fast and reliable but also simplify ongoing maintenance, allowing you to focus on content and growth rather than server management.
Implementing Caching Strategies for Speed
Caching is the single most impactful technique for scaling a WordPress site under heavy traffic. By storing pre-rendered static copies of your dynamic pages, caching dramatically reduces the number of database queries and PHP executions required for each visitor. This not only slashes server load but also delivers content to users in milliseconds instead of seconds. For a high-traffic WordPress site, caching is not optional—it is foundational. Without it, even a moderately popular post can overwhelm shared hosting or strain a dedicated server. The goal is to serve the fastest possible version of your site to the largest number of concurrent visitors, and caching strategies are the primary means to achieve that.
Setting Up Page Caching with Plugins like WP Rocket or W3 Total Cache
Page caching is the first line of defense. It generates a static HTML file of each page after the first visit and serves that file to subsequent visitors, bypassing the heavy PHP and database layers. Two of the most popular and powerful plugins for this are WP Rocket and W3 Total Cache. Both offer robust page caching capabilities, but they differ in complexity and approach.
WP Rocket is a premium plugin known for its user-friendliness and out-of-the-box effectiveness. After activation, page caching is enabled by default. Key steps include:
- Activating the plugin and verifying that “Enable caching for mobile devices” is checked if your audience uses mobile.
- Configuring cache lifespan—typically set to 24 hours for most sites, but adjust downward if content updates frequently.
- Enabling separate caching for logged-in users or administrators to avoid serving stale versions.
- Using the “Preload” feature to rebuild cache after content changes, ensuring the first visitor after an update doesn’t hit a slow uncached page.
W3 Total Cache is a free, highly configurable plugin that offers granular control. Its setup requires more attention:
- Navigate to Performance > General Settings and enable Page Cache.
- Choose the cache method: “Disk: Enhanced” is reliable for most setups, but “Redis” or “Memcached” (if available) provides faster retrieval for high-traffic environments.
- Set the “Cache TTL” (time-to-live) to 3600 seconds (1 hour) as a starting point, then adjust based on traffic patterns.
- Under “Advanced,” enable “Cache URIs with query string” only if necessary, as it can fragment the cache.
- Use the “Purge Policy” to automatically clear cache when posts or pages are updated.
A comparison of these two plugins for page caching:
| Feature | WP Rocket | W3 Total Cache |
|---|---|---|
| Ease of setup | Very easy, minimal configuration | Moderate, requires careful tweaking |
| Cost | Premium (paid) | Free |
| Default caching | Enabled immediately | Disabled, must be enabled manually |
| Mobile caching | Built-in with separate cache files | Configurable via “User agent groups” |
| Preloading | Automatic with sitemap-based crawler | Manual or via cron job |
| Performance impact | Lightweight, optimized for speed | Feature-rich, can be heavier if over-configured |
For high-traffic sites, both plugins work well, but WP Rocket is often preferred for its simplicity and reliability. Whichever you choose, test thoroughly after configuration to ensure pages are being served from cache and that dynamic elements (like shopping carts or comment forms) work correctly.
Leveraging Browser Caching for Reusable Resources
Browser caching instructs visitors’ browsers to store static assets—such as images, CSS files, JavaScript, fonts, and logos—locally for a specified period. When a user returns to your site or navigates to another page, their browser loads these resources from the local cache instead of downloading them again. This reduces HTTP requests and speeds up page load times for repeat visitors, which is critical for high-traffic scenarios where many users browse multiple pages.
To enable browser caching, you need to set appropriate cache-control headers. The most effective method is through your server configuration or a caching plugin. Here’s how to implement it:
- Using a caching plugin: Both WP Rocket and W3 Total Cache include browser caching settings. In WP Rocket, enable “Browser caching” under the “Cache” tab. In W3 Total Cache, go to Performance > Browser Cache and check “Set expires header” and “Set cache control header.”
- Via .htaccess (Apache servers): Add rules to set expiration times. For example, set images to cache for one month, CSS and JavaScript for one week, and HTML for a shorter period. A typical snippet:
<IfModule mod_expires.c>
  ExpiresActive On
  ExpiresByType image/jpg "access plus 1 month"
  ExpiresByType image/jpeg "access plus 1 month"
  ExpiresByType image/gif "access plus 1 month"
  ExpiresByType image/png "access plus 1 month"
  ExpiresByType text/css "access plus 1 week"
  ExpiresByType application/javascript "access plus 1 week"
  ExpiresByType text/html "access plus 1 hour"
</IfModule>
- Using a content delivery network (CDN): Most CDNs, such as Cloudflare or KeyCDN, automatically set optimal browser caching headers. If you use a CDN, you may not need additional server-level configuration.
Best practices for browser caching on high-traffic sites:
- Set longer cache durations for static assets that rarely change (images, fonts, logos). A month or more is safe.
- Use shorter durations for CSS and JavaScript if you update them frequently, but combine with versioning (e.g., style.css?v=2) to force browsers to download new versions when files change.
- Avoid caching HTML pages for too long, as they contain dynamic content. One hour is typical for most blogs.
- Test with tools like GTmetrix or Pingdom to verify that cache headers are being sent correctly and that resources are being cached.
When browser caching works in tandem with page caching, returning visitors experience near-instantaneous load times because their browser already has most of the site’s assets stored locally.
Using Object Caching with Redis or Memcached
Object caching stores the results of database queries in memory, so that subsequent requests for the same data are served from a high-speed cache rather than querying the database again. This is especially valuable for high-traffic WordPress sites that rely heavily on dynamic content, such as user-generated comments, custom post types, or e-commerce product listings. The two most common in-memory caching systems are Redis and Memcached.
Redis is an advanced key-value store that supports data persistence, complex data structures, and replication. It is widely recommended for WordPress because of its reliability and performance. To set it up:
- Ensure Redis is installed on your server. Many managed WordPress hosts (e.g., Kinsta, WP Engine) include Redis by default. For self-hosted sites, install the Redis server via your package manager (e.g.,
sudo apt install redis-serveron Ubuntu). - Install a WordPress plugin like Redis Object Cache or W3 Total Cache (which includes Redis support). Activate the plugin and navigate to its settings.
- In Redis Object Cache, enable the cache by clicking “Enable Object Cache.” The plugin will automatically connect to the local Redis instance.
- For W3 Total Cache, go to Performance > General Settings, select “Redis” under “Object Cache Method,” and enter the server details (usually
127.0.0.1and port6379). - Monitor cache hit rates. A high hit rate (above 90%) indicates effective caching. If the rate is low, consider increasing the memory allocated to Redis or adjusting the expiration times.
Memcached is a simpler, distributed memory caching system that excels at storing small, frequently accessed data. It is less feature-rich than Redis (no persistence, no complex data types) but is extremely fast and lightweight. Setup steps:
- Install Memcached on your server (e.g.,
sudo apt install memcached). - Install a WordPress plugin such as W3 Total Cache or Memcached Object Cache. In W3 Total Cache, select “Memcached” as the object cache method and provide the server address and port (default
11211). - Configure the cache timeout. For most WordPress sites, setting expiration to 300–600 seconds (5–10 minutes) balances freshness with performance.
- Ensure that Memcached has enough memory allocated. A typical starting point is 64 MB, but high-traffic sites may need 256 MB or more.
Comparison of Redis and Memcached for object caching:
| Feature | Redis | Memcached |
|---|---|---|
| Data persistence | Yes (optional) | No |
| Supported data types | Strings, hashes, lists, sets, sorted sets | Strings only |
| Replication | Yes (master-slave) | No |
| Ease of setup | Moderate, requires server installation | Moderate, requires server installation |
| Performance | Excellent for complex queries | Excellent for simple key-value lookups |
| WordPress plugin support | Widespread (Redis Object Cache, W3 Total Cache) | Good (W3 Total Cache, Memcached Object Cache) |
For high-traffic WordPress sites, Redis is generally the preferred choice due to its persistence and ability to handle more complex caching needs. However, if your server resources are limited and your data access patterns are simple, Memcached can be a leaner alternative. Regardless of which you choose, object caching should be combined with page caching and browser caching for a comprehensive speed optimization strategy. Test your site under simulated high traffic using tools like Loader.io or K6 to confirm that object caching reduces database load and maintains fast response times.
Optimizing Images and Media Files
When a WordPress site begins to attract high traffic, every millisecond of load time matters. Large, unoptimized images are among the most common culprits for slow page speeds, directly impacting user experience and search engine rankings. For a high-traffic site, even a single heavy image can multiply bandwidth costs and frustrate visitors on slower connections. The goal is to deliver visually rich media without compromising performance. This means compressing files intelligently, serving the right format for each device, and offloading delivery to a global network. Below, we break down the three essential strategies to achieve this: choosing the right formats and tools, implementing lazy loading, and leveraging a content delivery network.
Choosing Image Formats and Compression Tools
Not all image formats are created equal, and the wrong choice can bloat your site. For high-traffic WordPress sites, the priority is balancing visual fidelity with file size. Modern formats like WebP and AVIF offer superior compression compared to legacy formats like JPEG and PNG, often reducing file sizes by 25–35% without noticeable quality loss. However, browser support varies, so you need a fallback strategy.
Recommended image formats for high-traffic sites:
- WebP: Ideal for photographs and complex graphics. Supported by all modern browsers (Chrome, Firefox, Edge, Safari 14+). Offers lossy and lossless compression.
- AVIF: Even better compression than WebP, but with narrower browser support (Chrome, Firefox, and limited Safari). Best for cutting-edge optimization.
- JPEG 2000 / JPEG XR: Legacy formats for older Safari and Internet Explorer, respectively. Use only as fallbacks.
- PNG: Only for images requiring transparency (e.g., logos, icons). Convert to WebP if transparency is needed.
Compression tools for WordPress:
| Tool | Type | Key Features | Best For |
|---|---|---|---|
| ShortPixel Image Optimizer | Plugin | Automatic WebP conversion, lossy/lossless/glossy options, bulk optimization | High-traffic sites needing hands-off automation |
| Imagify | Plugin | Three compression levels, WebP support, lazy loading included | Budget-friendly, all-in-one solution |
| Smush | Plugin | Lossy compression, lazy loading, CDN add-on (paid) | Simple setup with basic needs |
| EWWW Image Optimizer | Plugin | Server-side compression, WebP/AVIF conversion, no API limits | Large media libraries or sites with custom hosting |
| Manual tools (e.g., TinyPNG, Squoosh) | Web/Desktop | Full control over compression, pre-upload optimization | Developers or sites with few images |
For high traffic, automate the process. Plugins like ShortPixel or EWWW can convert images to WebP on the fly and serve fallbacks via <picture> tags. Always test compression levels: lossy at 80–85% quality usually retains visual fidelity while cutting file sizes in half. Avoid over-compressing, which introduces artifacts that degrade user experience.
Implementing Lazy Loading for Images and Videos
Lazy loading delays the loading of images and videos until they are about to enter the viewport. On a high-traffic site, this is critical because it reduces initial page weight, speeds up the time to first paint, and saves bandwidth for both the server and the visitor. WordPress has supported native lazy loading via the loading="lazy" attribute since version 5.5, but for advanced control, a dedicated plugin or manual implementation is better.
Why lazy loading matters for high traffic:
- Reduces the number of HTTP requests on initial load, freeing server resources for other visitors.
- Lowers bandwidth costs, especially for pages with many images (e.g., galleries, product pages).
- Improves perceived performance—users start interacting sooner.
Methods to implement lazy loading:
- Native WordPress lazy loading: Enabled by default for images and iframes. Simple but limited—no control over thresholds or video elements.
- Plugin-based lazy loading: Use a dedicated plugin like WP Rocket, Lazy Load by WP Rocket, or Smush. These add lazy loading to images, videos, iframes, and even background images. They also allow custom thresholds (e.g., load 200px before the viewport) and exclude specific elements.
- Manual JavaScript implementation: For developers, use the
Intersection Observer APIto create custom lazy loading. This offers maximum control but requires coding and testing.
Best practices for lazy loading:
- Always set a placeholder (e.g., a low-quality blur or a solid color) to prevent layout shifts.
- Use
loading="lazy"for below-the-fold images, but keep above-the-fold images (hero banners, critical CTAs) loaded immediately. - For videos, lazy loading is especially effective. Use a poster image and load the video only when the user interacts or scrolls near it.
- Test with tools like Google PageSpeed Insights or Lighthouse to ensure lazy loading does not negatively impact Largest Contentful Paint (LCP).
Using a Content Delivery Network (CDN) for Media Assets
A Content Delivery Network (CDN) distributes your media files across a global network of servers. When a visitor requests an image or video, it is served from the server closest to them, drastically reducing latency. For a high-traffic WordPress site, a CDN is non-negotiable—it offloads bandwidth from your origin server, absorbs traffic spikes, and improves load times for international visitors.
How a CDN optimizes media delivery:
- Edge caching: Static files (images, CSS, JS) are cached on CDN nodes. Subsequent requests hit the edge, not your server.
- Automatic optimization: Many CDNs offer built-in image compression, WebP conversion, and resizing on the fly.
- DDoS protection: CDNs filter malicious traffic, keeping your site stable during surges.
Popular CDN options for WordPress:
| CDN Service | Integration | Key Features | Pricing Model |
|---|---|---|---|
| Cloudflare | Plugin or DNS | Free plan, automatic image optimization (Polish), WebP, Mirage (lazy loading) | Free tier available; paid plans for advanced features |
| KeyCDN | Plugin or API | Pay-as-you-go, HTTP/2, real-time analytics, image optimization add-on | Usage-based (low minimum) |
| BunnyCDN | Plugin or DNS | Flat-rate pricing, edge caching, image optimization, DDoS protection | Pay-as-you-go with volume discounts |
| StackPath | Plugin or API | High-performance edge network, Web Application Firewall (WAF) | Monthly subscription |
| Amazon CloudFront | Plugin (e.g., WP Offload Media) | Deep integration with S3, scalable, global edge locations | Usage-based (complex pricing) |
Steps to integrate a CDN for media in WordPress:
- Choose a CDN provider that supports your traffic volume and budget. Cloudflare is excellent for beginners; BunnyCDN offers simplicity and low costs.
- Configure your CDN to pull files from your origin server. Most providers offer a WordPress plugin that automates URL rewriting (e.g., CDN Enabler, W3 Total Cache).
- Enable image optimization on the CDN side. For example, Cloudflare’s “Polish” feature compresses images and converts them to WebP automatically.
- Set cache rules for media files: long cache durations (e.g., 30 days) for images and videos, with versioning or cache busting for updates.
- Test and monitor using tools like GTmetrix or WebPageTest. Ensure that cached files are served from the CDN and that the origin server load decreases.
Important considerations:
- Use a CDN that supports HTTP/2 or HTTP/3 for multiplexed file delivery.
- For dynamic media (e.g., user-uploaded images), consider a CDN with real-time purging and origin pull.
- Always enable SSL/TLS on your CDN to avoid mixed content warnings.
By combining the right formats, compression tools, lazy loading, and a CDN, your WordPress site can handle high traffic without buckling under the weight of media files. Each layer reduces the load on your server and improves the experience for every visitor, no matter where they are. Start with one step, measure the improvement, and iterate—your site’s performance will thank you.
Minimizing HTTP Requests and Reducing Bloat
When a WordPress site experiences a surge in traffic, every millisecond of load time matters. One of the most impactful ways to improve performance under high load is by reducing the number of HTTP requests your site makes and eliminating unnecessary bloat. Each HTTP request—whether for a CSS file, a JavaScript file, a font, or an image—adds latency, especially on mobile networks or under concurrent user strain. By consolidating and cleaning up your assets, you can significantly lower server response times and bandwidth usage, ensuring your site remains responsive even during traffic spikes.
The core principle is simple: fewer requests mean faster page loads. But achieving this requires a systematic approach. Below, we break down three critical areas where you can cut bloat and streamline your WordPress setup.
Combining and Minifying CSS and JavaScript Files
WordPress themes and plugins often load multiple separate CSS and JavaScript files. A typical site might load a dozen or more individual stylesheets and scripts, each requiring its own HTTP request. Combining these files into fewer, larger files reduces the number of round trips to the server.
Best practices for combining:
- Use a caching plugin: Plugins like WP Rocket, W3 Total Cache, or Autoptimize can automatically combine CSS and JS files into one or two bundles. This is the easiest method for most users.
- Prioritize critical CSS: For above-the-fold content, inline the essential CSS directly in the HTML head, and defer the combined stylesheet. This eliminates render-blocking while still reducing requests.
- Check for conflicts: Combining files can sometimes break plugin functionality if scripts depend on load order. Test thoroughly after enabling combination.
Minification explained:
Minification removes unnecessary characters from code—such as whitespace, comments, and line breaks—without affecting functionality. This reduces file size by 30% to 60% on average. For example, a minified CSS file might look like a single line of compressed code:
body{font-size:16px;color:#333}.header{background:#fff}
Minification works hand-in-hand with combination. After combining, minify the resulting file for maximum savings.
Tools and methods:
| Method | Pros | Cons |
|---|---|---|
| Plugin (e.g., Autoptimize) | Easy setup, no coding required | May conflict with some themes |
| Manual via build tools (Gulp, Webpack) | Full control, no plugin overhead | Requires developer skills |
| CDN-level minification (e.g., Cloudflare) | Offloads processing to edge servers | Limited to basic minification |
Key metrics to track:
- Number of CSS/JS requests before and after combination
- Total file size of combined vs. separate files
- Page load time (using tools like GTmetrix or WebPageTest)
Eliminating Render-Blocking Resources
Render-blocking resources are CSS and JavaScript files that prevent the browser from rendering page content until they are fully downloaded and parsed. This is a major contributor to slow perceived load times, especially on high-traffic sites where server response times may already be elevated.
How render-blocking works:
When a browser encounters a <link rel="stylesheet"> in the HTML head, it pauses rendering until the CSS is loaded. Similarly, synchronous <script> tags block rendering. For high-traffic WordPress sites, these delays compound under load, frustrating users and increasing bounce rates.
Strategies to eliminate render-blocking:
- Defer JavaScript: Add the
deferorasyncattribute to non-critical script tags.deferloads scripts in order after HTML parsing, whileasyncloads as soon as possible without blocking. Usedeferfor most scripts to maintain execution order. - Inline critical CSS: Extract the CSS needed for above-the-fold content (typically 10-20 lines) and place it directly in a
<style>tag in the HTML head. Then load the full stylesheet asynchronously using a method likemedia="print" onload="this.media='all'". - Use a plugin for automation: Plugins like WP Rocket or Flying Pages can handle deferring and inlining with one click. They also preload critical resources to further speed up rendering.
- Audit with Lighthouse: Google’s Lighthouse tool reports all render-blocking resources and provides specific recommendations. Run it regularly after deploying changes.
Common pitfalls:
- Deferring scripts that need to run before page paint (e.g., jQuery in the header). Always test critical functionality.
- Inlining too much CSS, which bloats the HTML and negates caching benefits. Keep critical CSS under 14 KB (compressed).
- Ignoring third-party scripts (e.g., analytics, ads). These often block rendering and should be loaded asynchronously or deferred.
By eliminating render-blocking resources, you allow the browser to display content immediately, improving perceived performance and reducing time to first meaningful paint—a critical factor for high-traffic sites where users expect instant feedback.
Auditing and Deactivating Unused Plugins and Themes
Every active plugin and theme on your WordPress site adds HTTP requests, database queries, and potential code bloat. Even if a plugin is not actively used on the front end, its scripts and styles may still load on every page. A thorough audit is essential for high-traffic optimization.
Step-by-step audit process:
- List all installed plugins: Go to Plugins > Installed Plugins in your WordPress dashboard. Note each plugin’s purpose and whether it is active.
- Check for unused functionality: Many plugins add features you no longer need—like a slider you replaced or a contact form you removed. Deactivate these immediately.
- Review plugin resource usage: Use a tool like Query Monitor or P3 Plugin Profiler to see how many HTTP requests and database queries each plugin adds. Plugins with heavy overhead should be replaced or optimized.
- Delete inactive themes: Keep only your active theme and a default fallback (like Twenty Twenty-Four). Deleting unused themes frees up server space and eliminates potential security risks.
- Test after deactivation: After removing plugins, test your site thoroughly to ensure no broken functionality. Use a staging environment if possible.
Common bloat sources to watch for:
- Page builders: Plugins like Elementor or WPBakery often load heavy CSS and JS on all pages, even if not used. Consider using lightweight alternatives or disabling assets on non-essential pages.
- Social sharing plugins: Many load scripts from multiple social networks, adding 5-10 requests. Use a lightweight plugin or inline sharing buttons.
- Analytics and tracking: While necessary, combine multiple tracking scripts (e.g., Google Analytics, Facebook Pixel) into a single tag using Google Tag Manager.
- Font plugins: Custom font plugins often load multiple font files. Limit to 2-3 font families and use system fonts where possible.
Benefits of a lean plugin setup:
| Area | Before Audit | After Audit |
|---|---|---|
| Number of active plugins | 25 | 12 |
| HTTP requests per page | 85 | 45 |
| Database query count | 120 | 60 |
| Page load time (3G) | 4.2 seconds | 2.1 seconds |
Regular audits—every quarter or after major updates—ensure your site stays lean. For high-traffic WordPress sites, every unnecessary plugin or theme is a liability. By combining and minifying CSS and JavaScript, eliminating render-blocking resources, and auditing your plugin and theme usage, you can dramatically reduce HTTP requests and bloat. This directly translates to faster load times, lower server costs, and a better experience for every visitor, even during peak demand.
Optimizing Database Performance
A clean, efficient database is the backbone of a high-traffic WordPress site. When thousands of visitors hit your site simultaneously, every millisecond matters. A bloated database with unnecessary data, outdated revisions, and inefficient queries can cause slow page loads, timeouts, and increased server load. By optimizing your database, you reduce the strain on your server, speed up query execution, and ensure your site remains responsive under heavy traffic. This section covers three essential strategies: scheduling regular cleanup and optimization, using indexing and query caching, and managing post revisions and spam comments.
Scheduling Regular Database Cleanup and Optimization
Over time, your WordPress database accumulates redundant data that serves no purpose but slows down performance. This includes transients, expired cache entries, orphaned metadata, and tables that become fragmented. Regular cleanup removes this clutter, while optimization reorganizes the database structure to improve query speed. For high-traffic sites, this is not a one-time task but an ongoing process that should be automated.
To implement this effectively, follow these steps:
- Use a plugin for automated cleanup: Plugins like WP-Optimize, Advanced Database Cleaner, or Sweep can schedule daily or weekly cleanups. They remove unnecessary data such as expired transients, spam comments, and unused tags without manual effort.
- Optimize database tables: After cleanup, run the MySQL
OPTIMIZE TABLEcommand on key tables likewp_posts,wp_postmeta, andwp_options. This defragments the storage and reclaims disk space, which speeds up read/write operations. Most optimization plugins include this feature. - Set a cron job for manual control: For advanced users, create a custom cron job that runs
wp db optimizevia WP-CLI every night. This avoids plugin overhead and ensures consistency. Example command:wp db optimize --all-tables. - Monitor database size: Use phpMyAdmin or a monitoring tool to track table sizes weekly. A sudden increase may indicate a leak, such as excessive transients or log entries, which you can address immediately.
By scheduling regular cleanup and optimization, you prevent the database from becoming a bottleneck during traffic spikes. Aim for at least a weekly cleanup for sites with moderate traffic, and daily for high-traffic sites.
Using Indexing and Query Caching
Indexing and query caching are two powerful techniques that dramatically reduce database load. Indexing allows MySQL to locate rows faster without scanning entire tables, while query caching stores the results of frequent queries so they don’t need to be recomputed. Together, they cut query execution time by orders of magnitude, which is critical when hundreds of users request similar data simultaneously.
Here’s how to implement both effectively:
- Add database indexes strategically: WordPress core tables already have primary indexes, but custom queries or plugins may lack them. Use a tool like Query Monitor to identify slow queries, then add indexes to columns used in
WHERE,JOIN, andORDER BYclauses. For example, if your site uses custom post types with meta queries, index themeta_keyandmeta_valuecolumns inwp_postmeta. RunCREATE INDEX idx_meta_key ON wp_postmeta (meta_key);in phpMyAdmin. - Enable MySQL query cache: In your
my.cnfor server configuration, setquery_cache_type = 1and allocate a suitable size (e.g.,query_cache_size = 256M). This caches the result of identical queries, so repeated requests for the same data (e.g., recent posts list) are served instantly from memory. Note: On MySQL 8.0+, query cache is deprecated; use alternative caching like Redis or Memcached instead. - Use object caching for database queries: Implement a persistent object cache with Redis or Memcached. This stores query results as objects, bypassing the database entirely for subsequent requests. Configure WordPress with a plugin like Redis Object Cache, which automatically caches all database queries and reduces load by up to 80%.
- Monitor query performance: Regularly review slow query logs using tools like Percona Toolkit or the MySQL slow query log. Identify queries that take longer than 0.5 seconds and optimize them with indexing or rewriting.
Combining indexing with query caching transforms your database from a potential bottleneck into a high-speed data engine. For high-traffic sites, this can mean the difference between a 200ms and a 2-second response time.
Managing Post Revisions and Spam Comments
Post revisions and spam comments are two of the biggest culprits of database bloat in WordPress. Each time you save a post, WordPress stores a full copy of the revision, including all metadata and content. Over months or years, a single post can accumulate hundreds of revisions, swelling the wp_posts and wp_postmeta tables. Similarly, spam comments, even if deleted, can linger in the database and waste storage and query resources. For high-traffic sites, this bloat increases backup size, slows down queries, and consumes server memory.
Take these actions to manage revisions and spam effectively:
- Limit post revisions to a reasonable number: Add
define('WP_POST_REVISIONS', 5);to yourwp-config.phpfile. This restricts WordPress to keeping only the last 5 revisions per post. For high-traffic sites, even 3 is sufficient. Alternatively, disable revisions entirely withdefine('WP_POST_REVISIONS', false);if you don’t need version history. - Remove existing revisions: Use a plugin like WP-Optimize or run a SQL query to delete all old revisions. Example query:
DELETE FROM wp_posts WHERE post_type = 'revision';(back up your database first). This can reclaim gigabytes of space. - Automatically delete spam comments: Set WordPress to delete spam comments after a period. Go to Settings > Discussion and enable “Delete spam comments after [X] days.” A value of 7 days is ideal. For existing spam, use a plugin to bulk delete all spam comments from the database.
- Prevent spam at the source: Use plugins like Akismet or Antispam Bee to block spam before it reaches the database. This reduces the need for cleanup and lowers server load from comment processing.
- Optimize comment table structure: If you have a large comment table (over 100,000 rows), consider archiving old comments to a separate table or removing those from deleted posts. This keeps the active
wp_commentstable lean.
By controlling post revisions and spam comments, you keep your database tables compact and queries efficient. This is a low-effort, high-impact optimization that every high-traffic WordPress site should implement immediately. Combined with regular cleanup and indexing, it ensures your database remains a fast, reliable foundation for handling traffic surges.
Leveraging a Content Delivery Network (CDN)
When your WordPress site begins to attract significant traffic, the origin server—the single machine that hosts your database and application files—can become a bottleneck. Each visitor request for images, CSS, JavaScript, and other static assets forces the server to process and transmit data, increasing load times and risking downtime. A Content Delivery Network (CDN) solves this by distributing copies of your static content across a global network of edge servers. When a user visits your site, the CDN serves assets from the edge server geographically closest to them, drastically reducing latency and offloading the majority of static file requests from your origin. This not only speeds up page loads for visitors in distant locations but also frees server resources to handle dynamic requests like database queries and user logins. For high-traffic WordPress sites, implementing a CDN is not optional; it is a fundamental scaling strategy.
Selecting a CDN Provider (Cloudflare, StackPath, etc.)
Choosing the right CDN provider depends on your budget, technical expertise, and specific performance needs. The market offers solutions ranging from free tiers suitable for small to medium sites to enterprise-grade services with advanced security and customization. Below is a comparison of popular CDN providers commonly used with WordPress:
| Provider | Key Features | Best For | Pricing Model |
|---|---|---|---|
| Cloudflare | Free plan with basic CDN, DDoS protection, SSL, and caching; paid plans include WAF, image optimization, and Argo Smart Routing. | Most WordPress sites, especially those on a budget or needing integrated security. | Free tier; paid plans start at $20/month. |
| StackPath | High-performance edge network with simple pricing, instant purge, and full HTTP/2 support; includes a web application firewall. | Sites requiring predictable pricing and low complexity. | Starting at $10/month per site. |
| KeyCDN | Pay-as-you-go pricing, real-time analytics, and support for HTTP/2, Brotli compression, and origin pull. | Developers wanting granular control and transparent usage billing. | Starting at $0.04/GB. |
| BunnyCDN | Flat-rate pricing with no bandwidth overage charges, edge caching, and easy integration with WordPress via plugins. | Sites with predictable traffic spikes or fixed budgets. | Starting at $1.25/month per site. |
| Amazon CloudFront | Deep integration with AWS ecosystem, custom SSL certificates, and Lambda@Edge for serverless customization. | Enterprise sites already using AWS services. | Pay-as-you-go based on data transfer and requests. |
When evaluating providers, consider these factors:
- Global Edge Locations: More points of presence (PoPs) mean lower latency for visitors worldwide. Cloudflare leads with over 300 PoPs, while others like BunnyCDN offer 100+.
- Ease of Setup: Cloudflare requires changing your domain’s nameservers, which can be intimidating for beginners. StackPath and BunnyCDN use simpler DNS-based integration.
- WordPress Compatibility: Ensure the provider works seamlessly with caching plugins (e.g., WP Rocket, W3 Total Cache) and does not break admin functionality.
- Security Features: DDoS protection, SSL/TLS support, and a web application firewall (WAF) are critical for high-traffic sites under constant attack.
- Cache Purging: Instant or near-instant cache purging is essential for updating content quickly without waiting for TTL expiration.
Configuring CDN for WordPress with Plugins
Integrating a CDN with WordPress is streamlined by dedicated plugins that handle URL rewriting, cache purging, and asset optimization. The following steps outline a typical configuration using a CDN plugin, such as the popular CDN Enabler or W3 Total Cache (which includes CDN support):
- Install and activate a CDN plugin. For most users, CDN Enabler (lightweight and simple) or W3 Total Cache (feature-rich) are reliable choices. Alternatively, many caching plugins like WP Rocket include built-in CDN integration.
- Obtain your CDN URL. After signing up with a provider, you will receive a CDN endpoint (e.g.,
yourdomain.b-cdn.netfor BunnyCDN oryourdomain.cloudfront.netfor CloudFront). For Cloudflare, the CDN is automatically active once you change nameservers, but you may need to enable “Proxied” DNS records. - Configure the plugin:
- In the plugin settings, enter the CDN URL (often called the “CDN Zone” or “Pull Zone”).
- Specify which file types to serve via the CDN. Common defaults include images (
.jpg, .png, .gif, .webp), CSS (.css), JavaScript (.js), and fonts (.woff, .woff2). - Enable “Rewrite URLs” so that all static asset links in your HTML point to the CDN domain instead of your origin.
- Set up SSL/HTTPS. If your site uses HTTPS, ensure the CDN supports SSL certificates. Most providers offer free SSL (e.g., Cloudflare’s Universal SSL). Configure the plugin to use HTTPS for CDN URLs.
- Test the configuration. Use browser developer tools or online tools like GTmetrix to verify that assets are loading from the CDN URL. Check for mixed content warnings (HTTP vs. HTTPS) and ensure no broken paths.
- Integrate with other caching layers. If using a page caching plugin, ensure CDN caching does not conflict. For example, in W3 Total Cache, enable the CDN module and set the “Cdn engine” to your provider, then configure “Advanced” options like “Reject user agents” for logged-in users to avoid caching admin sessions.
Optimizing CDN Cache Rules and Purging
Once your CDN is active, fine-tuning cache rules maximizes performance while ensuring content freshness. Misconfigured caching can serve stale files or miss optimization opportunities. Here are key optimization strategies:
- Set appropriate Time-to-Live (TTL) values:
- Static assets (images, CSS, JS) that rarely change: TTL of 30 days or more.
- Theme and plugin assets updated with releases: TTL of 1 week.
- Dynamic content (e.g., API responses, user-specific files): TTL of 0 or short durations (minutes).
- Enable Brotli or Gzip compression: Most CDNs support automatic compression of text-based assets. Verify that compression is enabled to reduce file sizes by up to 70%.
- Use cache key normalization: Configure the CDN to ignore query strings (e.g.,
?v=1.2) unless they affect content. This prevents cache fragmentation. For WordPress, strip common query parameters likeutm_*andfbclid. - Implement cache purging strategies:
- On-demand purging: When you update a post, plugin, or theme, purge only the affected CDN cache URLs. Many WordPress plugins (e.g., WP Rocket, W3 Total Cache) support automatic purging via API when content changes.
- Manual purging: For major site updates (e.g., redesign, new theme), use the CDN dashboard to purge all cache. Cloudflare offers a “Purge Everything” button; StackPath provides a “Purge Cache” option for the entire zone.
- Scheduled purging: Some providers allow scheduled cache refreshes (e.g., every 24 hours) to ensure content stays current without manual intervention.
- Leverage origin pull vs. push zones:
- Origin pull: The CDN fetches assets from your origin server on first request and caches them. This is simpler and recommended for most WordPress sites.
- Push zones: You manually upload assets to the CDN. This offers more control but adds complexity. Use only if you need to serve assets from a different domain or have custom file structures.
To test cache effectiveness, monitor CDN analytics for cache hit ratio—a high ratio (above 90%) indicates that most requests are served from edge servers, reducing origin load. If the ratio is low, review your TTL settings and ensure that dynamic content is excluded from caching. Additionally, use HTTP headers like Cache-Control: public, max-age=31536000 for static files and Cache-Control: no-cache for admin pages. By systematically applying these rules, you transform your CDN from a simple offload tool into a finely tuned performance accelerator that keeps your WordPress site fast and resilient under heavy traffic.
Implementing Advanced Security and Rate Limiting
When a WordPress site experiences high traffic, the risk of malicious activity increases proportionally. Attackers often target popular sites with Distributed Denial-of-Service (DDoS) attacks, brute force login attempts, or excessive API requests that can overwhelm server resources and degrade performance for legitimate users. Implementing advanced security and rate limiting is not just about protecting data—it is a critical performance optimization strategy. By filtering out malicious traffic and capping request frequencies, you preserve bandwidth, CPU, and memory for genuine visitors. This section covers three essential layers of protection: Web Application Firewall rules, rate limiting configurations, and security plugins that actively block threats.
Setting Up Web Application Firewall (WAF) Rules
A Web Application Firewall acts as a gatekeeper between your WordPress site and incoming traffic. It inspects each request and blocks those that match known attack patterns, such as SQL injection, cross-site scripting (XSS), or malformed HTTP headers. For high-traffic sites, a WAF reduces server load by rejecting malicious requests before they reach your WordPress core or database.
There are two primary approaches: cloud-based WAFs and server-level WAFs. Cloud-based options, such as those offered by Cloudflare, Sucuri, or AWS WAF, are highly recommended for high-traffic environments because they offload filtering to a global network of edge servers. This not only protects your origin server but also absorbs large-scale DDoS attacks far from your infrastructure. To set up a cloud WAF:
- Choose a provider that integrates with your DNS and CDN setup.
- Configure security rules to block common threats: enable OWASP Top 10 protections, restrict access to wp-admin by IP whitelist, and block requests with suspicious user agents or empty referrers.
- Enable challenge-based protections (e.g., JavaScript challenges or CAPTCHAs) for sensitive endpoints like login pages, but avoid overusing them on static content to prevent false positives.
- Monitor WAF logs weekly to adjust rules—whitelist legitimate traffic that may be flagged, and tighten rules for persistent attack sources.
For server-level WAFs, ModSecurity combined with the OWASP Core Rule Set is a powerful open-source option. Install it via your web server (Apache or Nginx) and customize the rule set to reduce false positives. Be aware that server-level WAFs consume CPU resources, so test performance impact during peak traffic. A well-tuned WAF can block up to 95% of malicious requests before they consume application resources, directly improving response times under load.
Configuring Rate Limiting via Plugins or Server
Rate limiting caps the number of requests a single IP address or user can make within a specific time window. This prevents a small number of aggressive clients—whether from a DDoS botnet, a web scraper, or a misconfigured plugin—from monopolizing server resources. For WordPress, rate limiting can be implemented at the server level, the application level, or both.
Server-level rate limiting is the most efficient because it operates before PHP processes the request. For Nginx, use the limit_req_zone directive. Example configuration:
- Define a zone:
limit_req_zone $binary_remote_addr zone=wordpress:10m rate=30r/s; - Apply it to location blocks:
limit_req zone=wordpress burst=20 nodelay; - This allows 30 requests per second per IP, with a burst capacity of 20 additional requests before throttling.
For Apache, use mod_ratelimit or mod_evasive. The latter is specifically designed to handle DDoS and brute force attacks by monitoring request rates and temporarily blocking offending IPs.
Plugin-based rate limiting offers more granular control for WordPress-specific endpoints. Popular plugins include:
| Plugin | Key Feature | Best For |
|---|---|---|
| Wordfence | Rate limit login attempts, comment submissions, and API calls | All-in-one security with rate limiting |
| Limit Login Attempts Reloaded | Simple IP blocking after failed logins | Brute force protection only |
| WP Cerber Security | Custom rate limits for any request type, plus traffic analytics | Advanced users needing fine-grained control |
When configuring plugin-based rate limits, set reasonable thresholds based on your traffic patterns. For example, limit login attempts to 5 per minute per IP, and REST API requests to 100 per minute. Overly strict limits can block legitimate users, so test during off-peak hours and monitor error logs. Combine server-level and plugin-level rate limiting for defense in depth: server rules handle the bulk of abusive traffic, while plugins catch application-specific anomalies.
Using Security Plugins to Block Malicious Traffic
Security plugins provide an additional layer of defense by actively scanning for threats, maintaining blacklists of known malicious IPs, and enforcing real-time traffic rules. For high-traffic WordPress sites, the right security plugin can reduce server load by preemptively blocking bots, scrapers, and attackers without consuming excessive resources. However, choose plugins that are lightweight and optimized for performance—avoid bloated solutions that add database queries or JavaScript on every page load.
Key features to look for in a security plugin for high-traffic sites:
- IP blacklist integration: Automatically block IPs from known attack sources (e.g., via Project Honey Pot or custom lists).
- Real-time traffic analysis: Identify and block patterns like rapid page refreshes, excessive 404 errors, or repeated POST requests to wp-login.php.
- Country or region blocking: If your audience is geographically limited, block traffic from regions with no legitimate users to reduce attack surface.
- Automatic temporary bans: Ban IPs that trigger multiple security rules within a short timeframe, with automatic unban after a cooldown period.
Recommended plugins and their roles:
- Wordfence: Includes a firewall, malware scanner, and live traffic monitoring. Its “Rate Limiting” feature can throttle aggressive crawlers and block IPs that exceed thresholds. Ensure you disable unnecessary features (e.g., live traffic view in production) to save resources.
- Sucuri Security: Focuses on cloud-based protection with a lightweight plugin that offloads scanning to Sucuri’s servers. It excels at blocking malicious traffic before it reaches your server, making it ideal for high-traffic sites.
- All In One WP Security & Firewall: Offers granular control over login, comment, and file access rules without heavy overhead. Use its “Brute Force” and “Firewall” tabs to set up custom rate limits and IP blacklists.
To maximize performance, combine a security plugin with server-level measures. For instance, use Wordfence to block application-layer attacks (e.g., XML-RPC brute force) while Nginx handles rate limiting at the transport layer. Regularly review security logs to fine-tune rules—high-traffic sites often see false positives from legitimate tools like search engine crawlers or CDN nodes. Whitelist those IP ranges to ensure uninterrupted service during traffic spikes. By layering WAF rules, rate limiting, and security plugins, you create a robust defense that keeps your WordPress site fast and available even under extreme load.
Monitoring and Scaling Resources Dynamically
For a high-traffic WordPress site, static resource allocation is a recipe for disaster. Traffic spikes from viral content, marketing campaigns, or seasonal events can overwhelm a server in seconds, leading to downtime, slow page loads, and lost revenue. The key to staying resilient is dynamic monitoring and scaling—continuously tracking CPU, RAM, bandwidth, and database load, then automatically adjusting resources to match real-time demand. This approach ensures your site remains fast and available even under extreme load, without overpaying for idle capacity during quiet periods.
Using Monitoring Tools like New Relic or Query Monitor
Effective scaling begins with granular visibility into your site’s performance. Two powerful tools for WordPress are New Relic and Query Monitor, each serving a distinct purpose. New Relic provides server-side and application-level insights, while Query Monitor offers a lightweight, WordPress-native dashboard for frontend and database debugging.
New Relic is an enterprise-grade application performance monitoring (APM) tool. It tracks server metrics like CPU usage, memory consumption, and disk I/O, alongside WordPress-specific data such as PHP execution time, MySQL query performance, and external API calls. To integrate it, install the New Relic PHP agent on your server and add the New Relic extension to your WordPress site via a plugin (e.g., New Relic Reporting for WordPress). Once active, you can view real-time transaction traces, identify slow database queries, and see which plugins or themes are most resource-intensive. For example, if a custom plugin triggers a tenfold increase in database queries during a traffic spike, New Relic will pinpoint that plugin’s specific function.
Query Monitor is a free, developer-focused plugin that adds a toolbar to your WordPress admin. It displays detailed information about database queries, HTTP requests, hooks, and PHP errors on every page load. While it doesn’t track server-level metrics like CPU, it excels at identifying frontend bottlenecks. Use it to check for slow SQL queries, excessive autoloaded options, or memory-hungry shortcodes. For instance, if a page loads with 500 database queries instead of the recommended 50, Query Monitor will list each query with execution time, helping you optimize or cache them.
For a comprehensive monitoring strategy, combine both tools:
| Tool | Primary Focus | Key Metrics | Best For |
|---|---|---|---|
| New Relic | Server & application performance | CPU, memory, transaction time, slow queries | Proactive scaling decisions, server-level optimization |
| Query Monitor | WordPress-specific debugging | Database query count, memory usage, hooks | Plugin/theme performance audits, frontend optimization |
Set up both tools before high traffic events to establish baseline metrics. For example, if your site normally uses 40% CPU at 1,000 concurrent users, any deviation during a spike signals a need for scaling.
Setting Up Auto-Scaling with Cloud Providers
Auto-scaling automatically adjusts your server resources—CPU, RAM, and bandwidth—based on predefined triggers. This is essential for handling unpredictable traffic spikes without manual intervention. Most cloud providers (AWS, Google Cloud, DigitalOcean, Linode) offer auto-scaling features, but implementation varies.
For cloud VPS platforms (e.g., AWS EC2, DigitalOcean Droplets):
- Define a launch template: Create a custom server image with your WordPress installation, caching layers (e.g., Redis, Varnish), and security configurations.
- Set scaling policies: Use metrics like CPU utilization (e.g., scale up when CPU exceeds 70% for 5 minutes), memory usage, or network throughput. For WordPress, also consider database connection count or PHP-FPM process count.
- Use a load balancer: Distribute incoming traffic across multiple instances. AWS Elastic Load Balancer or DigitalOcean Load Balancers can route requests to healthy servers while automatically adding or removing instances.
- Database scaling: For high traffic, separate your database (e.g., Amazon RDS, DigitalOcean Managed Database) and enable read replicas. Auto-scale read replicas based on query load.
For serverless or managed WordPress (e.g., Kinsta, WP Engine, Cloudways):
- These platforms often include built-in auto-scaling. For example, Kinsta uses Google Cloud’s auto-scaling infrastructure to add containers when traffic spikes, while Cloudways offers vertical scaling (increasing CPU/RAM on a single server) with one-click triggers.
- Verify your plan’s scaling limits. Some managed hosts cap auto-scaling at a certain number of resources unless you upgrade to a higher tier.
Implementation checklist for auto-scaling:
- Ensure your WordPress installation is stateless: Store media files on a CDN (e.g., Cloudflare, BunnyCDN) and sessions in Redis or a database.
- Use a shared object cache (Redis or Memcached) to reduce database load during scaling events.
- Configure health checks: Auto-scaling groups should only add instances that pass health checks (e.g., HTTP 200 on a test URL).
- Test with a simulated traffic spike using tools like Loader.io or Apache JMeter before going live.
For example, if your site typically handles 5,000 concurrent users with 2 servers, an auto-scaling policy could add a third server when CPU hits 75%, then remove it when usage drops below 40% for 10 minutes. This keeps costs low while ensuring performance.
Creating Alerts for Critical Performance Thresholds
Alerts transform raw monitoring data into actionable notifications. Without them, you might only discover a resource crunch after your site goes down. Set up alerts for three categories: resource exhaustion, performance degradation, and scaling failures.
Critical thresholds to monitor:
- CPU usage: Alert if CPU exceeds 80% for more than 5 minutes. Sustained high CPU often indicates a PHP process bottleneck or a runaway script.
- Memory usage: Alert if RAM usage exceeds 90% for 2 minutes. This can cause swapping, which severely slows WordPress.
- Bandwidth: Alert if bandwidth usage approaches 80% of your plan’s limit. For cloud servers, set alerts for network throughput (e.g., >500 Mbps).
- Database connections: Alert if active connections exceed 80% of the maximum. This is a common failure point for high-traffic WordPress sites.
- Page load time: Alert if average TTFB (Time to First Byte) exceeds 2 seconds for 1 minute. This indicates backend strain.
How to set up alerts:
- New Relic: Create alert policies for “High CPU Utilization,” “High Memory Usage,” and “Apdex Score” (user satisfaction). Use the New Relic API to integrate with Slack, PagerDuty, or email.
- Cloud provider tools: AWS CloudWatch can trigger alarms for EC2 CPU, RDS connections, and load balancer latency. DigitalOcean offers monitoring alerts for Droplet CPU and memory.
- Third-party monitoring: Use UptimeRobot or Pingdom for external uptime and response time alerts. These detect if your site becomes unreachable, which internal tools might miss during a server crash.
Alert response workflow:
- Immediate action: For critical alerts (e.g., CPU at 95%), auto-scale resources or restart PHP-FPM. Use cloud provider APIs to trigger scaling scripts.
- Diagnosis: Check New Relic transaction traces to identify the source (e.g., a specific plugin or a surge in bot traffic).
- Mitigation: If auto-scaling is insufficient, temporarily block non-critical traffic (e.g., using Cloudflare’s rate limiting) or switch to a static version of the site.
- Postmortem: Adjust thresholds or scaling policies based on the event. For instance, if a 10-second spike caused downtime, reduce the scaling trigger time from 5 minutes to 2 minutes.
By combining monitoring tools, auto-scaling infrastructure, and intelligent alerts, you create a self-regulating system that keeps your WordPress site performant under any traffic load. This proactive approach eliminates the guesswork of manual scaling and ensures your site delivers a seamless experience even during the busiest periods.
Testing and Iterating for Ongoing Optimization
Optimizing a high-traffic WordPress site is not a one-time task. As your content library grows, user behavior shifts, and your infrastructure evolves, what worked yesterday may become a bottleneck today. Regular performance testing ensures that every caching rule, CDN edge, and server tweak continues to deliver peak speed and reliability under real-world loads. This section outlines a disciplined approach to testing and iteration, enabling you to catch regressions early, validate improvements, and maintain a seamless experience for every visitor.
Conducting Load Testing with Tools like Apache JMeter
Load testing simulates concurrent user traffic to reveal how your WordPress site performs under stress. Apache JMeter is a powerful, open-source tool that can model thousands of virtual users hitting your site simultaneously, helping you identify breaking points before they affect real visitors. To conduct meaningful load tests, follow these steps:
- Define realistic user scenarios. Model common visitor paths: browsing the homepage, reading a blog post, submitting a comment, or completing a purchase. JMeter allows you to record these actions via its HTTP(S) Test Script Recorder.
- Configure ramp-up periods. Gradually increase the number of concurrent users (e.g., from 50 to 500 over 5 minutes) to observe how server response times and error rates escalate. Avoid sudden spikes that don’t reflect natural traffic patterns.
- Monitor server resources. While JMeter runs, watch CPU, memory, database query rates, and PHP worker processes on your server. Tools like New Relic, Datadog, or even the hosting control panel’s metrics can correlate JMeter’s results with backend strain.
- Set pass/fail thresholds. Define acceptable response times—typically under 2 seconds for page loads—and a maximum error rate (e.g., 0.5% of requests). If your site exceeds these during a test, you have a bottleneck to address.
After each test, analyze JMeter’s Aggregate Report or Summary Report. Look for the 90th percentile response time, which indicates the experience for most users, and check for any HTTP 500 or 503 errors. Common fixes include increasing PHP memory limits, enabling object caching (Redis or Memcached), or tuning your database indexes. Run load tests after every major plugin update, theme change, or content spike to ensure your optimizations hold.
A/B Testing Caching and CDN Configurations
Caching and content delivery networks (CDNs) are foundational to high-traffic WordPress performance, but misconfigured settings can actually harm user experience—for example, by serving stale content or failing to cache dynamic elements. A/B testing allows you to compare two configurations side by side, using real traffic data to determine which delivers faster load times and lower server load. Here’s how to set up effective A/B tests:
- Choose one variable at a time. Test caching duration (e.g., 1 hour vs. 24 hours for page cache), CDN compression algorithms (Brotli vs. Gzip), or edge caching rules (cache static assets only vs. cache entire HTML pages). Changing multiple variables simultaneously makes it impossible to attribute improvements to a single change.
- Split traffic with a tool. Use a reverse proxy like Nginx or a CDN provider (Cloudflare, Fastly, or KeyCDN) to route 50% of visitors to configuration A and 50% to configuration B. Many CDNs offer built-in A/B testing features, or you can use WordPress plugins like WP Rocket (which includes a “split testing” mode for cache settings).
- Measure key metrics. Track Time to First Byte (TTFB), Largest Contentful Paint (LCP), and cache hit ratio for each group. Tools like Google PageSpeed Insights, WebPageTest, or your CDN’s analytics dashboard can provide side-by-side comparisons. Also monitor server CPU usage under the same traffic load to see which configuration reduces backend strain.
- Run tests for at least one week. Traffic patterns vary by day of week and time of day. A short test (e.g., 2 hours) may capture only a specific user segment. Extend the test to capture weekend spikes, bot traffic, and different geographic regions.
For example, you might test whether enabling “Serve stale content while revalidating” on your CDN improves perceived performance for returning visitors. Configuration A (stale-while-revalidate enabled) could show a 15% lower LCP, while configuration B (no stale content) might have higher cache freshness. The winner depends on your content type—news sites may prioritize freshness, while evergreen blogs can benefit from faster load times. Document each test’s results and apply the winning configuration, then test another variable.
Scheduling Periodic Performance Audits
Without regular audits, even the best-optimized WordPress site can degrade silently. Plugins accumulate bloat, database tables grow fragmented, and third-party scripts become outdated. A scheduled performance audit—conducted monthly for high-traffic sites—ensures you catch these issues before they impact users. Use the following checklist to structure your audits:
| Audit Area | What to Check | Frequency |
|---|---|---|
| Page load speed | Measure LCP, TTFB, and First Input Delay (FID) for 5 key pages (homepage, top post, product page, etc.) using WebPageTest or Lighthouse. | Monthly |
| Caching effectiveness | Verify page cache hit ratio (target >90%), object cache hit ratio (target >95%), and CDN cache hit ratio (target >80%). | Bi-weekly |
| Database health | Check for orphaned post revisions, transients, and spam comments. Run OPTIMIZE TABLE on high-traffic tables (e.g., wp_options, wp_posts). | Monthly |
| Plugin and theme performance | Audit active plugins for memory usage and query count. Remove unused plugins and replace heavy ones (e.g., replace a bloated page builder with a lightweight block editor). | Quarterly |
| Content delivery network | Review CDN logs for error rates (5xx), purge stale cache for updated content, and ensure edge rules still match current URL structures. | Monthly |
| Security and updates | Check for outdated PHP versions, WordPress core updates, and plugin patches that may introduce performance regressions. | Weekly |
During each audit, use a consistent testing environment—ideally a staging copy of your site—to avoid affecting live users. Compare results against a baseline taken immediately after your last optimization. If you see a 10% drop in cache hit ratio or a 500ms increase in TTFB, investigate the cause: a recent plugin update may have introduced uncacheable cookies, or a new third-party script might be blocking rendering. Create a remediation log with timestamps and actions taken, such as “Sept 15: Disabled WooCommerce cart fragments for guest users, restored cache hit ratio to 92%.” This iterative process transforms optimization from a static fix into a living practice that scales with your traffic.
Sources and further reading
- WordPress Performance Optimization – WordPress Developer Resources
- How to Scale WordPress – Kinsta
- Caching – WordPress.org Documentation
- Load Balancing – NGINX Documentation
- Google PageSpeed Insights – Google Developers
- Web Performance Best Practices – MDN Web Docs
- HTTP/2 and HTTP/3 – IETF RFC 9113
- PHP Performance Tuning – PHP.net
- WordPress Multisite for High Traffic – WordPress Codex
- Using Varnish Cache – Varnish Software
Need help with this topic?
Send us your details and we will contact you.